Release notes 24.4
We're happy to announce the last major version of Dataedo in 2024! Read on to find out what new features and improvements we implemented.
Data Quality
Data quality refers to the measure of how well data meets the requirements of its intended use. It ensures that the data is accurate, consistent, complete, and reliable, which is essential for effective decision-making. High-quality data minimizes errors and builds trust in your data.
Since the definition of "good" data varies depending on specific needs or use cases, we let you customize what data to check and define your own expectations for the data.
Creating rule instances
Note: Read more on rule instance creation in the documentation.
You can create an instance in the Portal using three different methods:
- From a column
- From a table
- From the Rule instances tab in the Data Quality section.
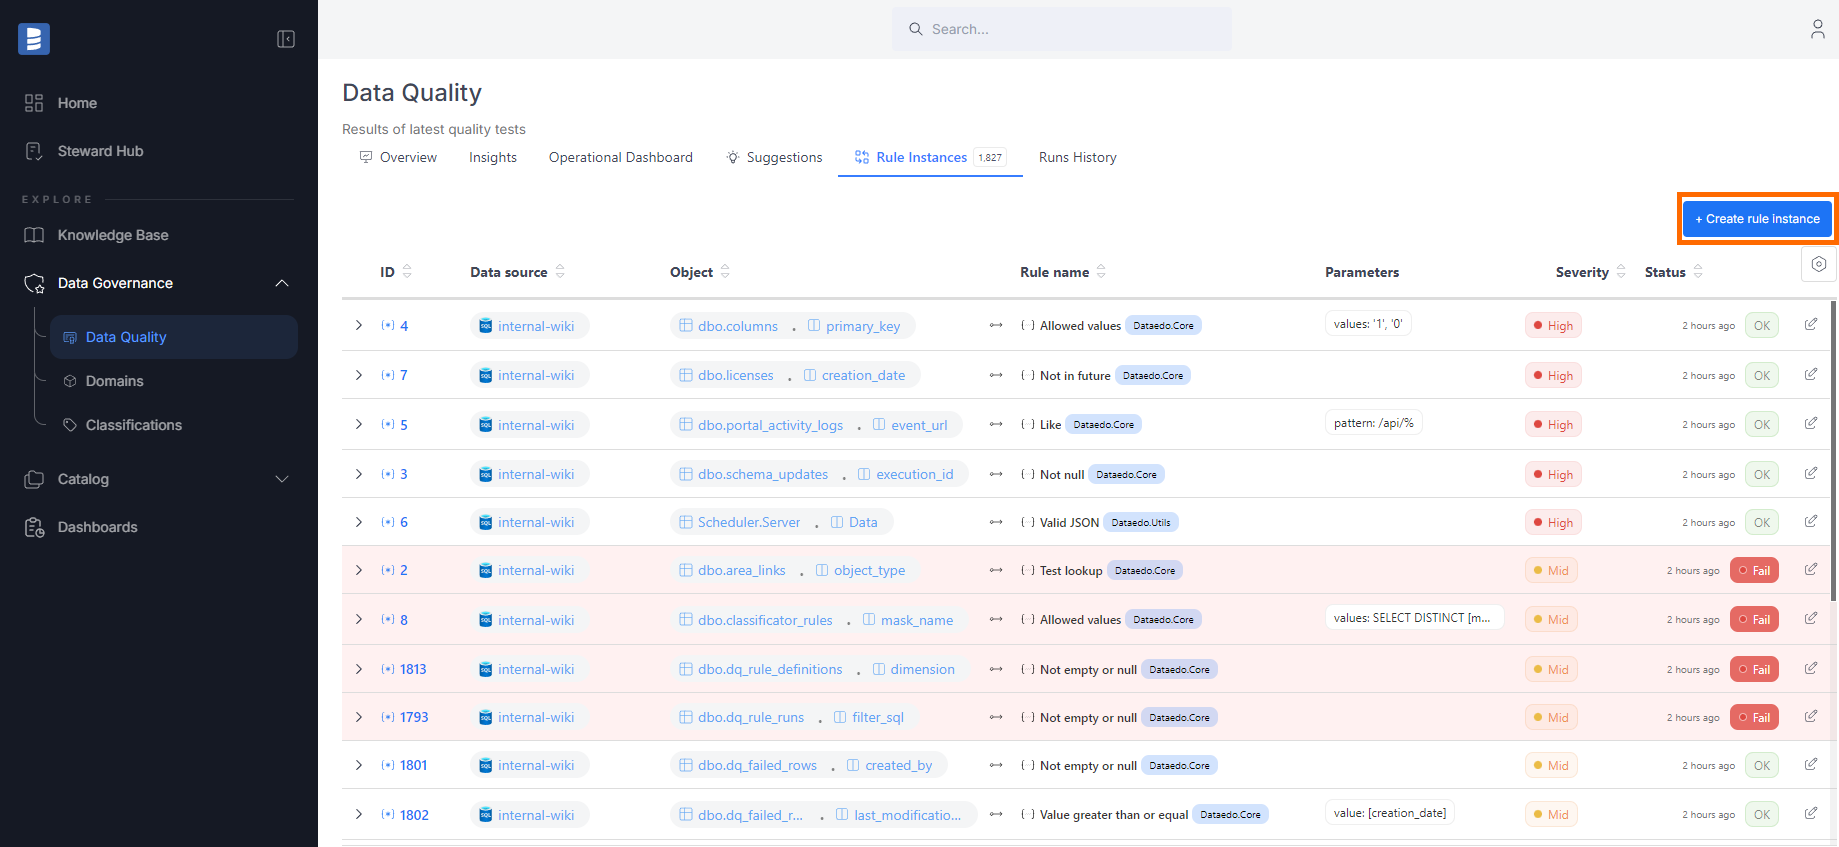
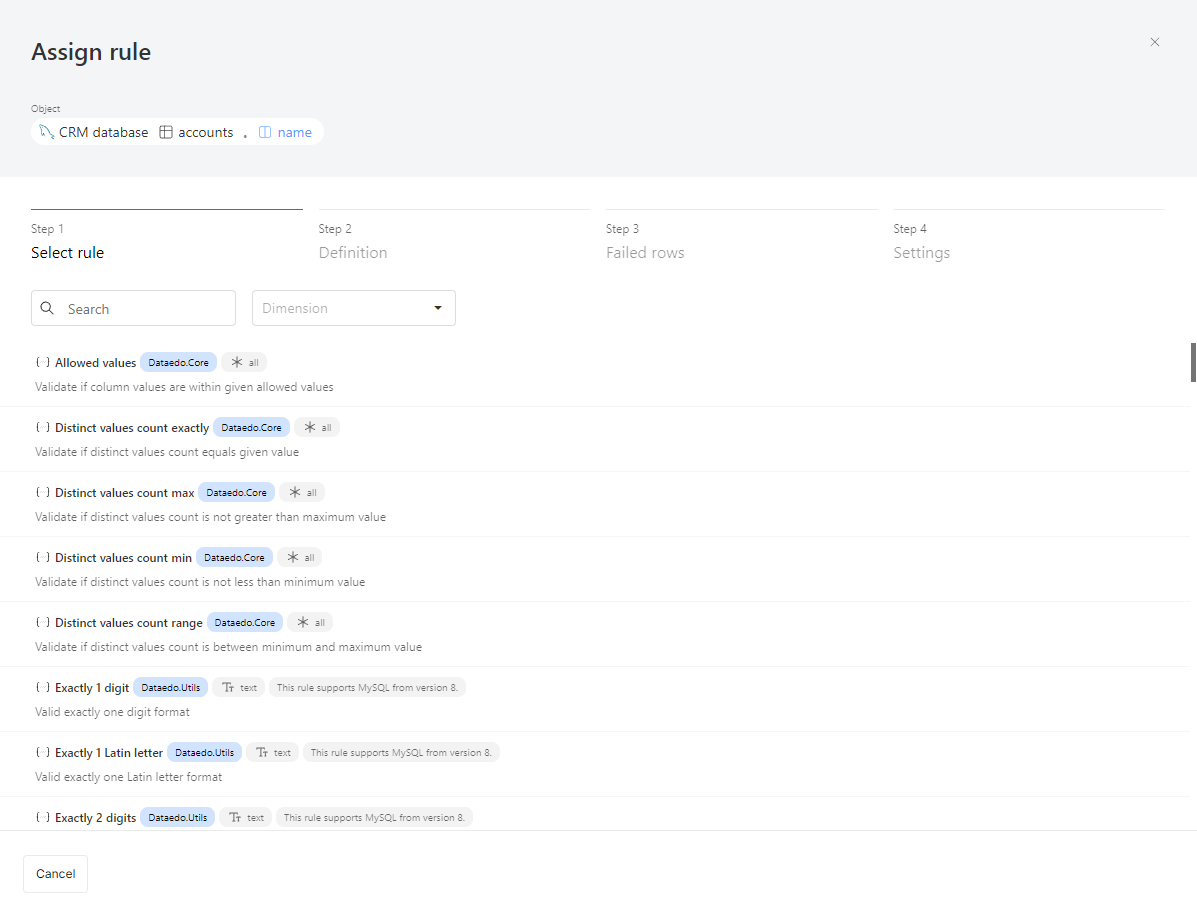
When choosing from a table or the Data Quality section, you will additionally need to select a column you want to assign the rule to.
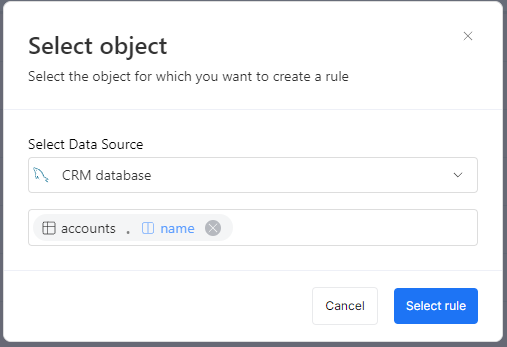
Step 1: Select a rule
After selecting a column, you'll need to choose a rule. Each rule has:
- A name and description to explain what it checks.
- A library it belongs to. In the future, you'll be able to create your own library with custom rules.
- Applicable column types:
- All: Can be assigned to any column.
- Text: For string-type columns.
- Date: For date-type columns.
Step 2: Parameters and filters
Note: Read more in the documentation.
Some rules need additional parameters to work, while others don’t. For example:
- "Not null": No extra parameters are needed. It simply checks if the selected column contains any null values.
- "Allowed values": Requires you to provide a list of valid values. The rule will then check if the column data matches this list.
- "Value range": Needs a minimum and maximum value to define what counts as correct. Data outside this range will be flagged.
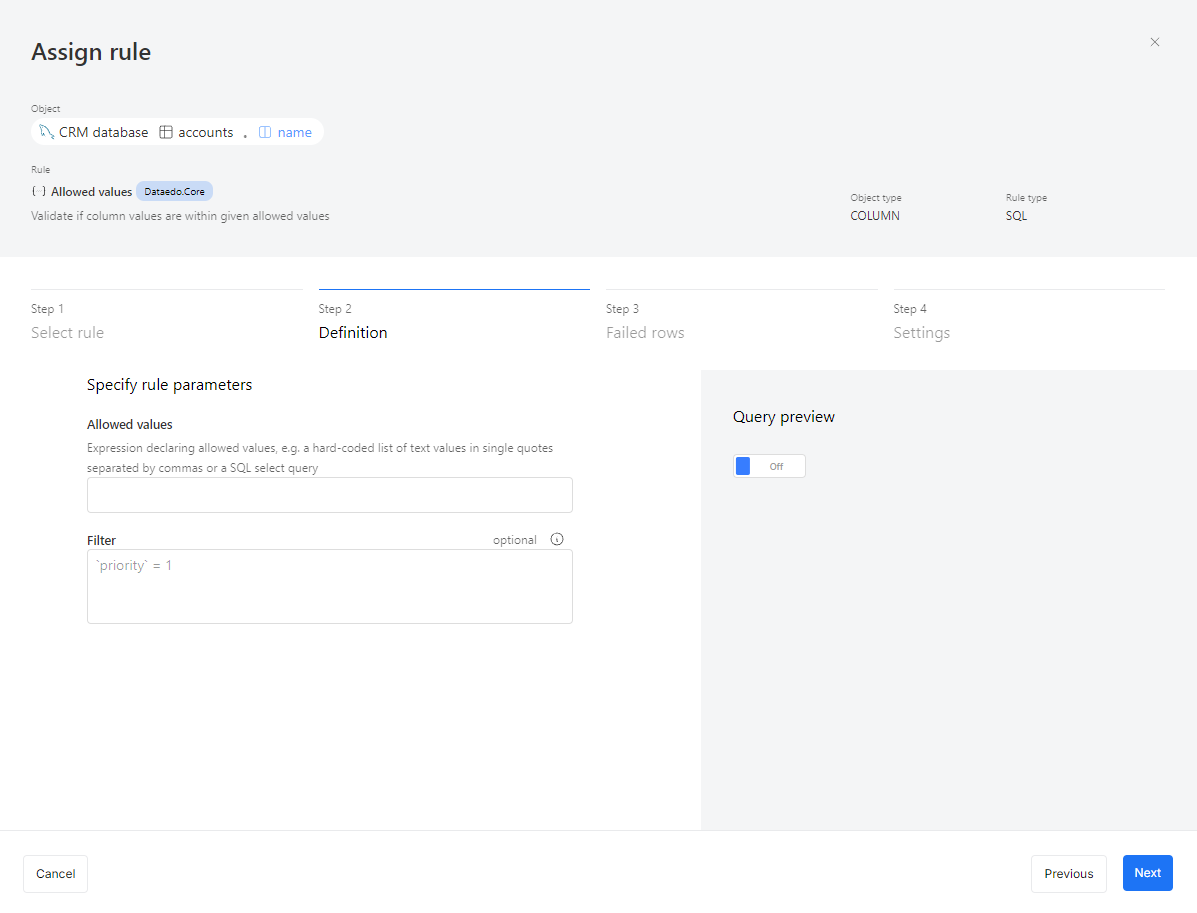
After entering the required parameters, you’ll see an optional field called Filter. This is useful when you don’t want to check all records in an instance.
For example, you might skip verifying email correctness for records created before 2015, when your company started email validation. Or, you might only want to check invoices marked as high priority.
Step 3: Failed rows
Note: Read more in the documentation.
By default, we only collect numeric statistics about your data quality. This means you'll see how many rows were tested and how many passed or failed.
In the third step of creating a rule instance, you can choose to save the failed rows to make it easier to find and fix them.
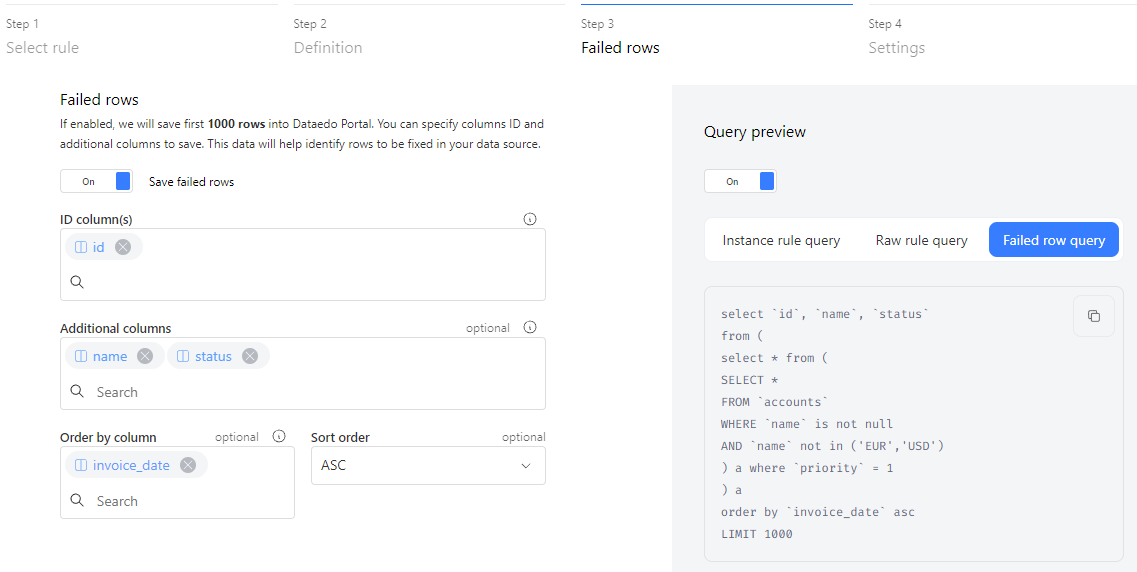
Step 4: Settings
The final step in the creation process is setting up the instance. You can choose the instance's state:
- Active: The rule will run during every scheduled Data Quality check.
- Draft: The rule will be created but won’t run until it’s set to active. You can change the state at any time by editing the instance.
Severity defines how important the instance is. For example, you could schedule critical rules to run daily, and lower-severity rules to run weekly.
Instance description is useful for noting details, like when a filter is applied. This helps business users understand that the rule is checking only a specific set of data.

Browsing Data Quality results
There are a few places in the Portal where you can view and browse Data Quality results.
Column and table
For each column with Data Quality rule instances assigned, users will see a Data Quality score on the column’s or table's overview. This score is the average percentage of all the rule instances applied to the column.

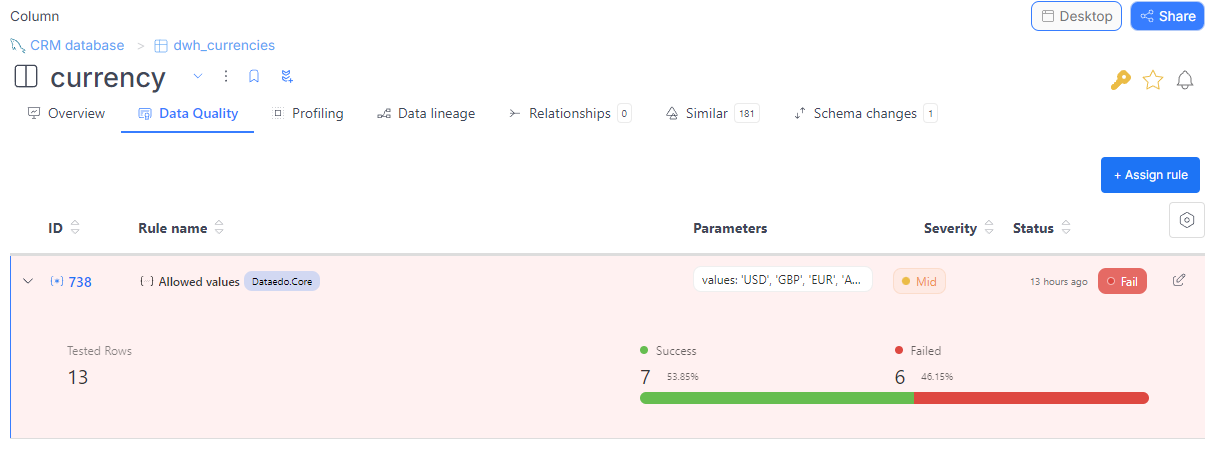
Users can also view the results in the Data Quality tab. There, you'll see a list of all the applied instances (to a column or to all table's columns), along with details like the rule name, parameters, severity, the status of the latest run, and the timestamp when it was executed.
Rule instances list
The Data Quality section in the main menu provides a complete list of instances from your entire repository. Each instance includes details such as the rule name, parameters, severity, the status of the latest run, and the timestamp of its execution.
By default, instances are sorted first by the timestamp of the last run, then by severity within the same timestamp, and finally by status.
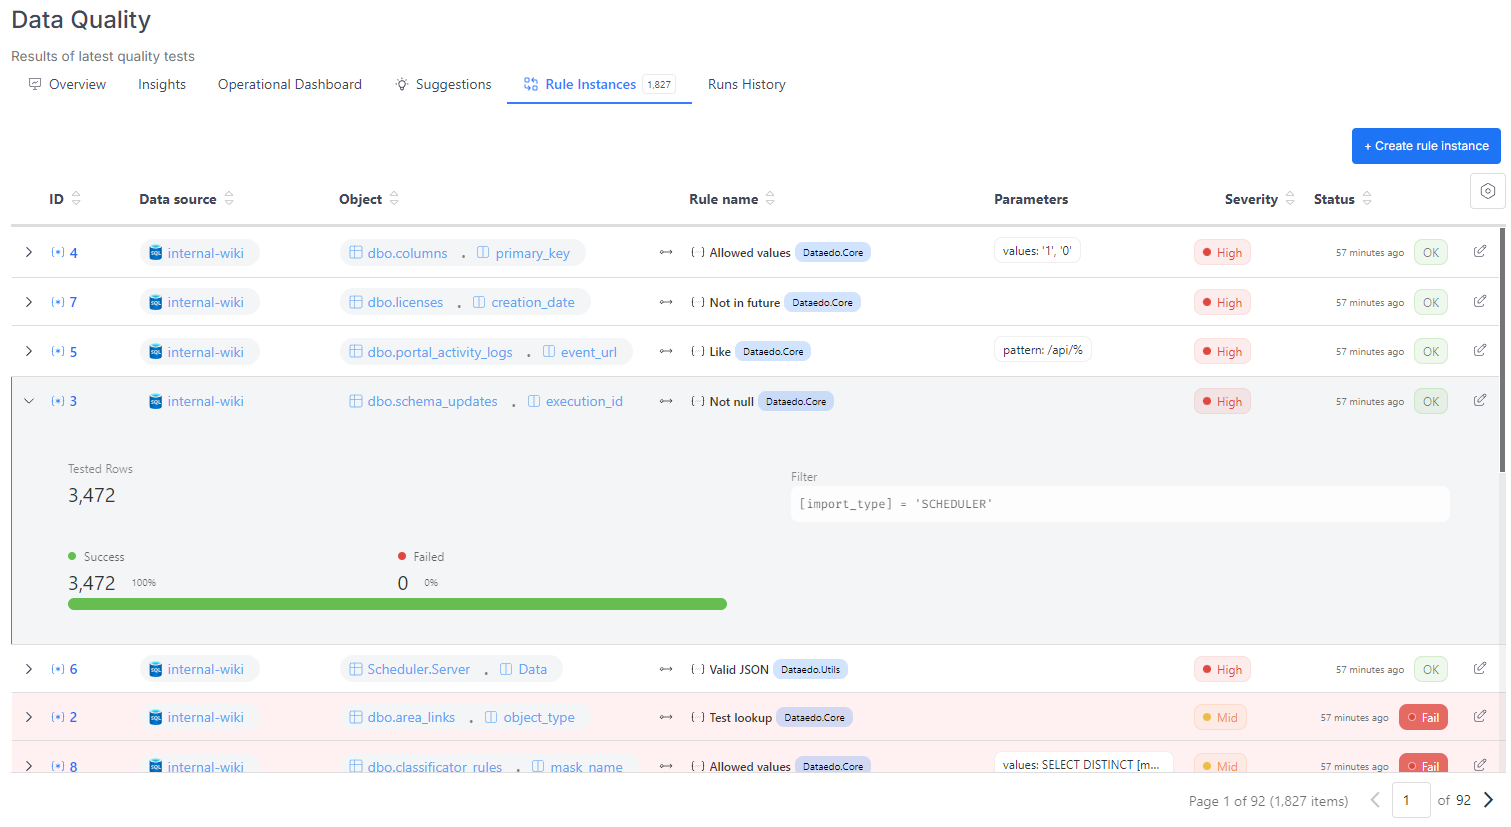
Rule instance details
If the instance hasn’t been run yet, it will display a section with its basic details, including:
- The rule to be checked.
- The column selected for the check.
- State (active or draft).
- Severity.
- Filter (if applied).
- Instance description (if provided).
If the instance has been run, in addition to the basic details above, you’ll see:
- The status of the last run (OK, Fail, or Error).
- A progress bar showing the number and percentage of successful and failed rows.
- The total number of tested rows.
- The fail rate.
- The timestamp of the last run.
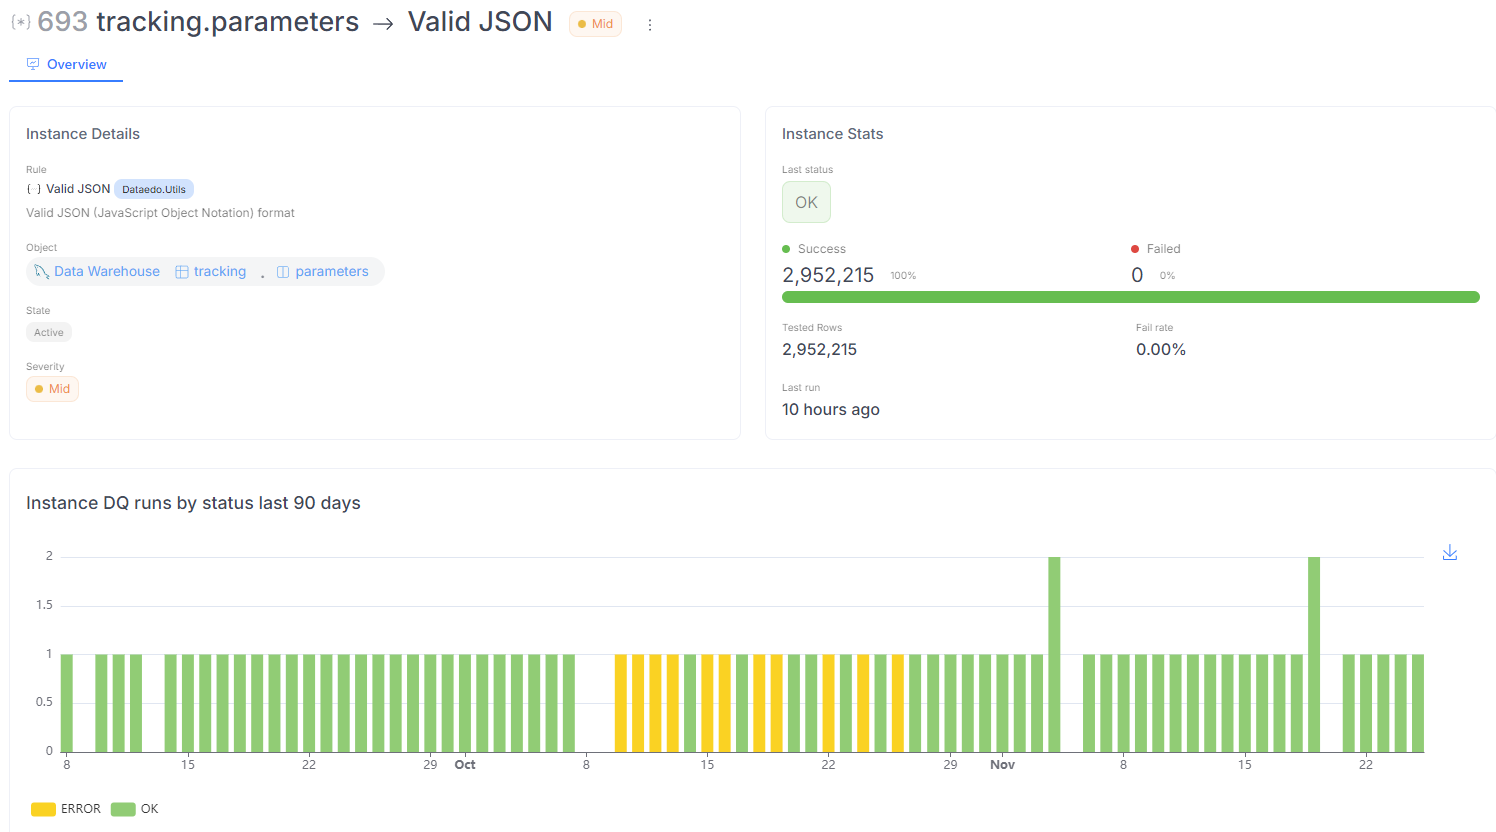
If the status is Error, a button will let you view more details about what went wrong. This error data is raw, so if you're unsure what caused the issue, please contact our support team for help.

Dashboards
We provide several dashboards to give you a better understanding of your data. The Overview dashboard shows basic statistics, including the overall Data Quality score, the total number of instances defined, and a breakdown of Data Quality runs by status.
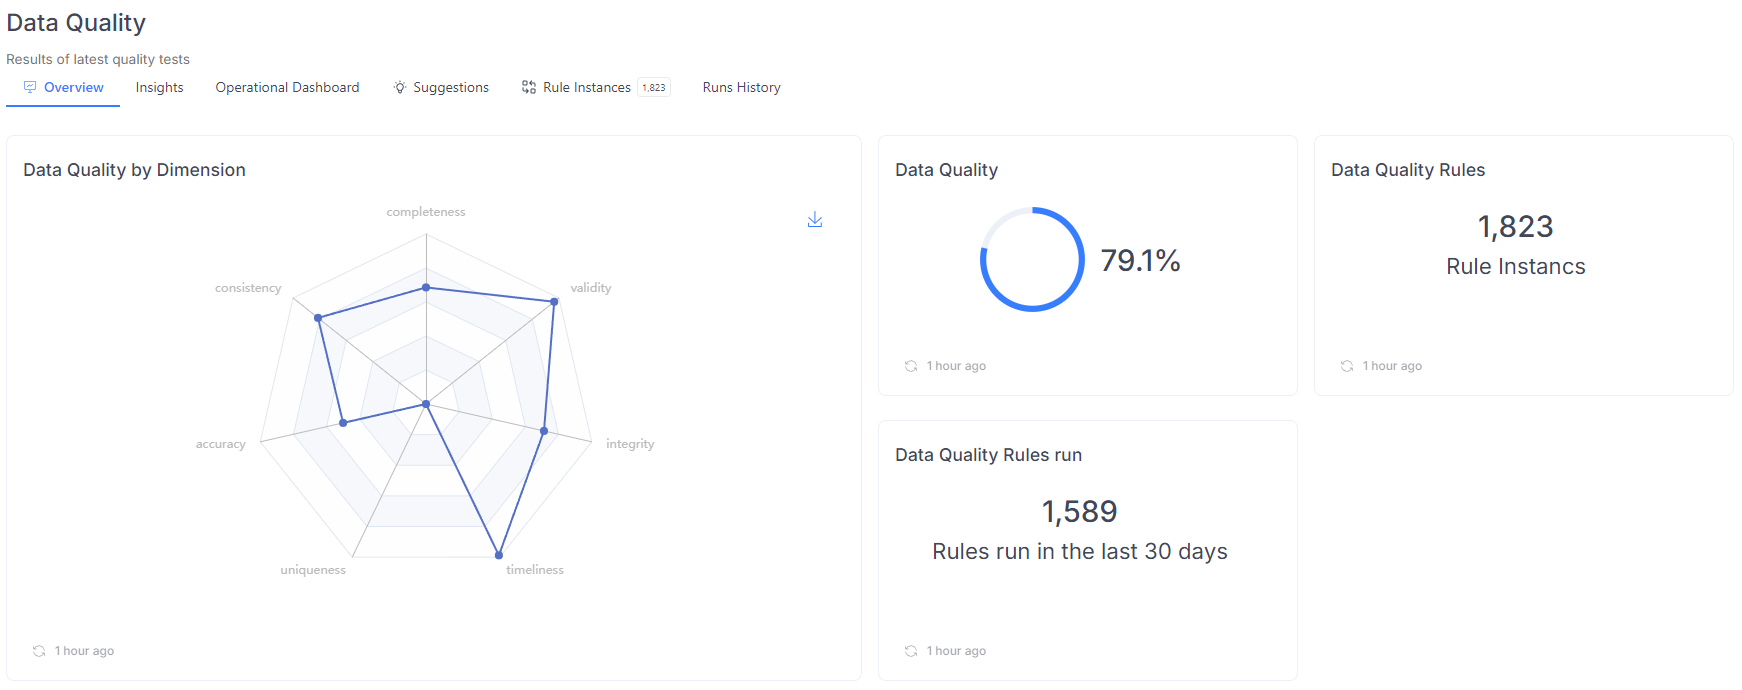
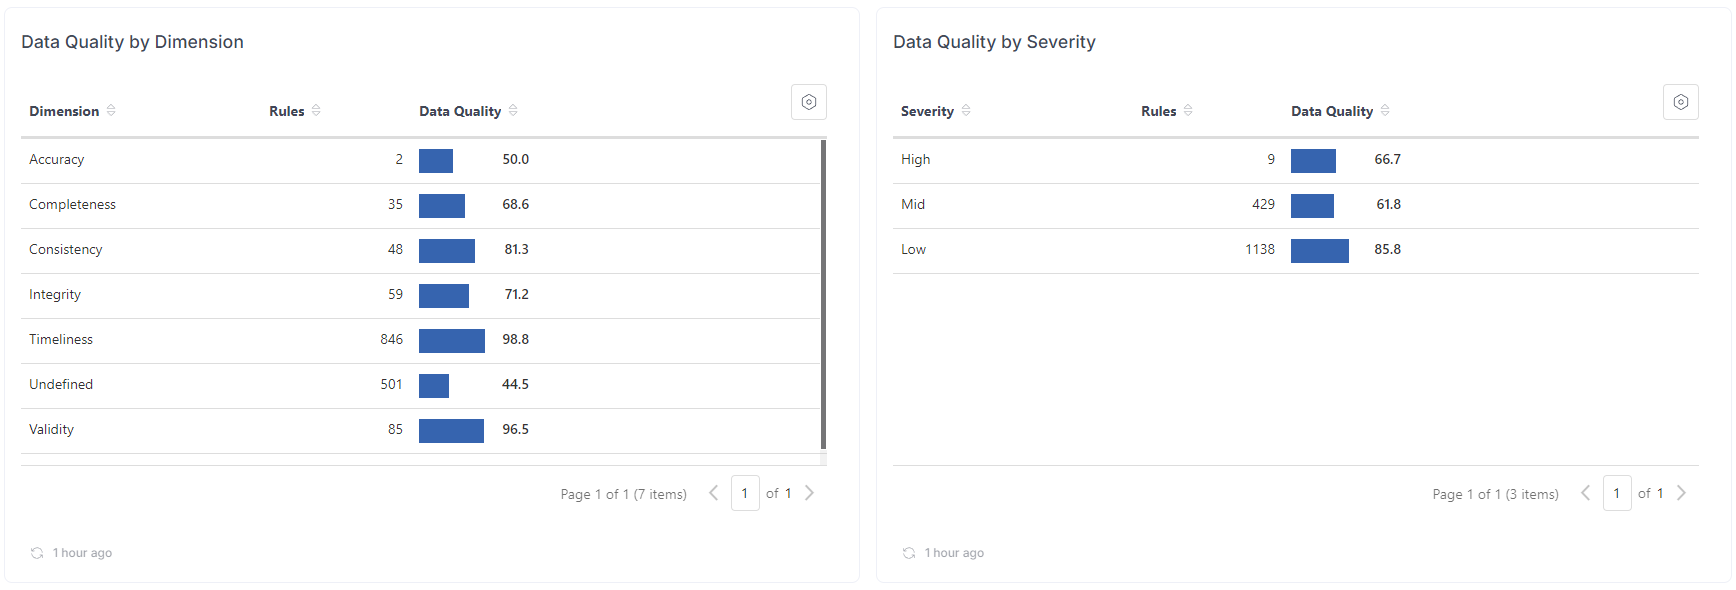
The Insights dashboard highlights actionable data, such as a list of empty columns and tables, missing data in unique columns, and columns where the row count has rapidly increased or decreased.
The operational dashboard displays a list of the most recent failed rows, helping you quickly identify and address data quality issues.
Running Data Quality
Data Quality is run via our scheduler. Read more here.
Supported connectors
The list of supported connectors is available here.
Badges
Badges serve as a way to mark objects as important or approved by a specific user. We've taken a flexible approach to this, allowing users to create custom badges to categorize objects—such as 'Master Data,' 'Critical Data,' 'Certified,' or any other label that fits your organization's needs.
Adding a badge on objects
Data Stewards can assign badges to any object to highlight its importance. To do this, they simply click the badge icon next to the object's name

and select one of the available badges from the popup menu. They also have the option to add a comment with any relevant details.
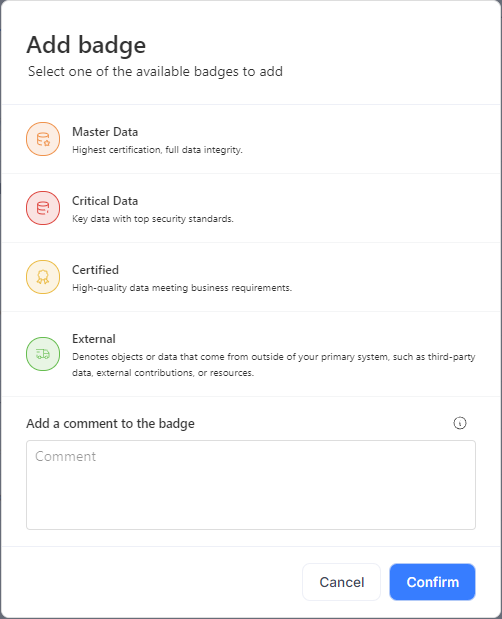
Once a badge is added, it will be visible on the object, with details displayed in the tooltip when hovered over.
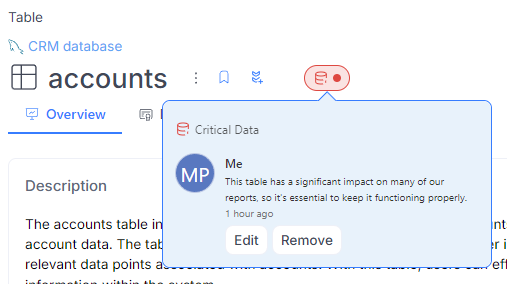
Multiple people can add the same badge to an object, and an object can have multiple badges assigned to it.
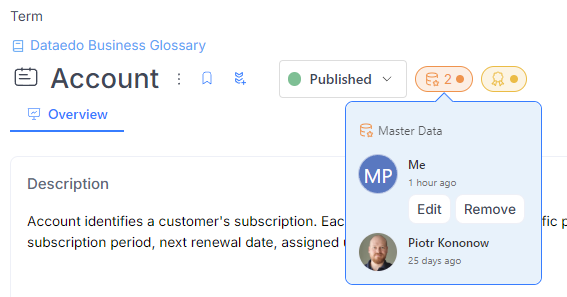
Each user can edit or remove their own badges.
Browsing badge lists
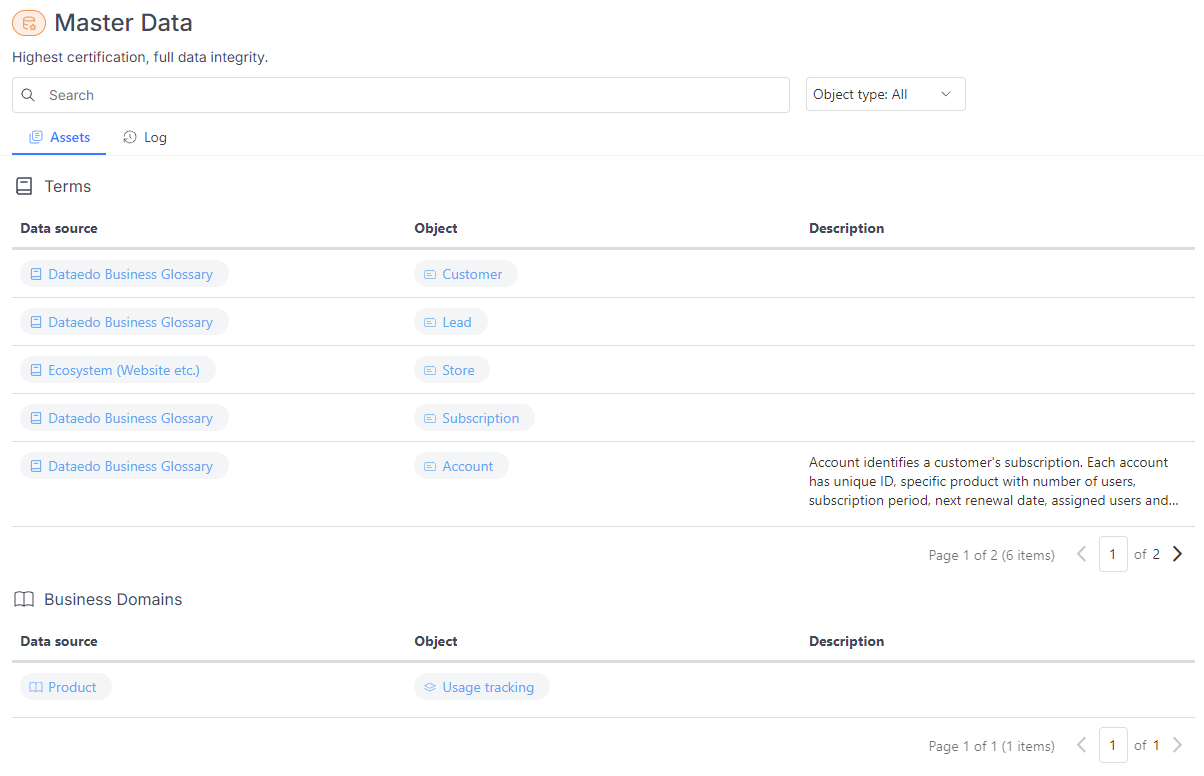
Badges are visible on all objects that have them. To simplify the search process, we’ve created badge lists. The "Badges" list includes all objects with any badge, grouped by object type. You can search within this list or narrow down the results by applying filters, such as by badge. This grouped view will always be available in the navigation under "Badges."
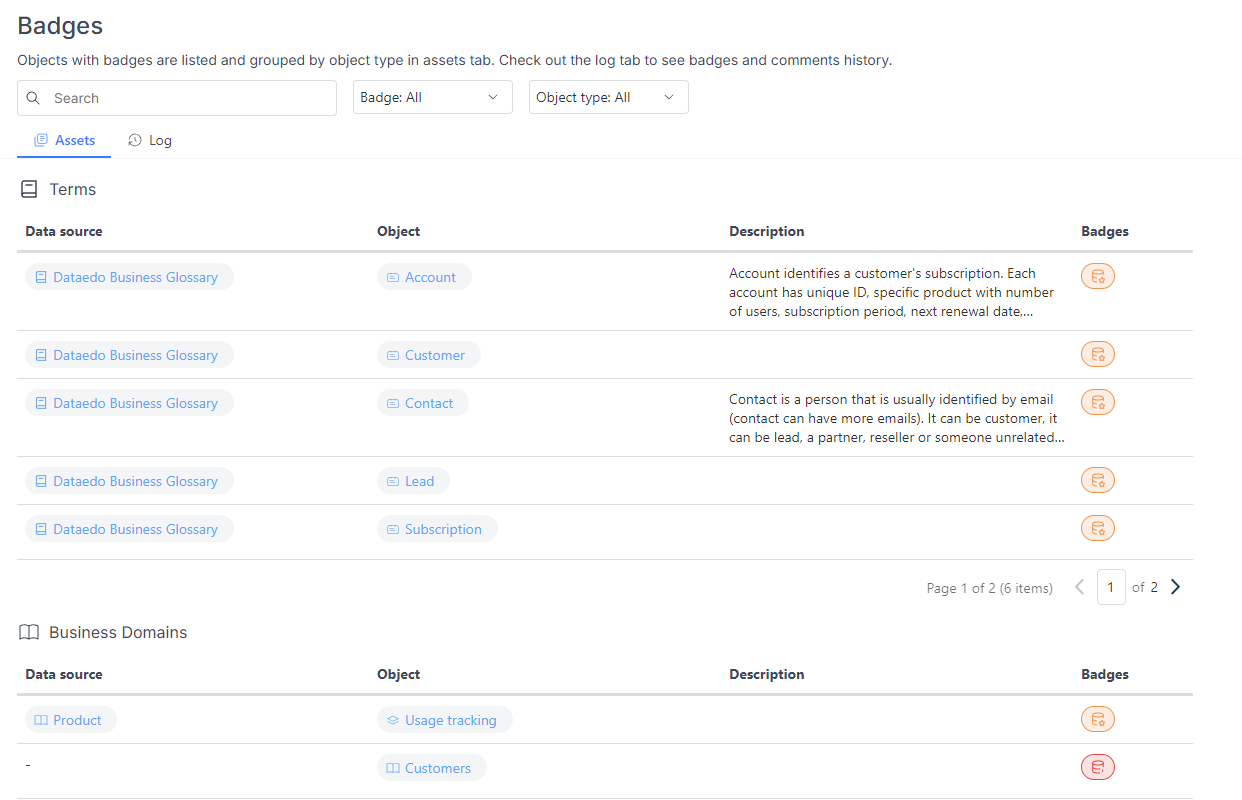
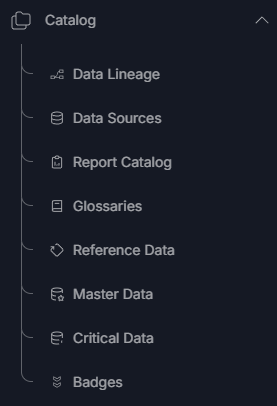
Additionally, by default, the "Critical Data" and "Master Data" lists will also be shown in the navigation. Your admin can customize which badge-related lists are visible in the main navigation.
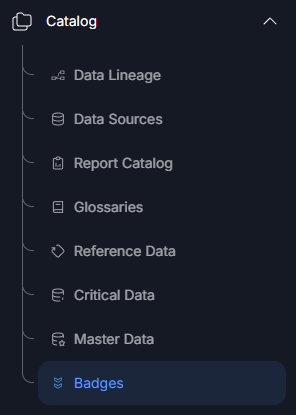
Each list is similar, with one key difference: it displays only objects with badges of a specific type.
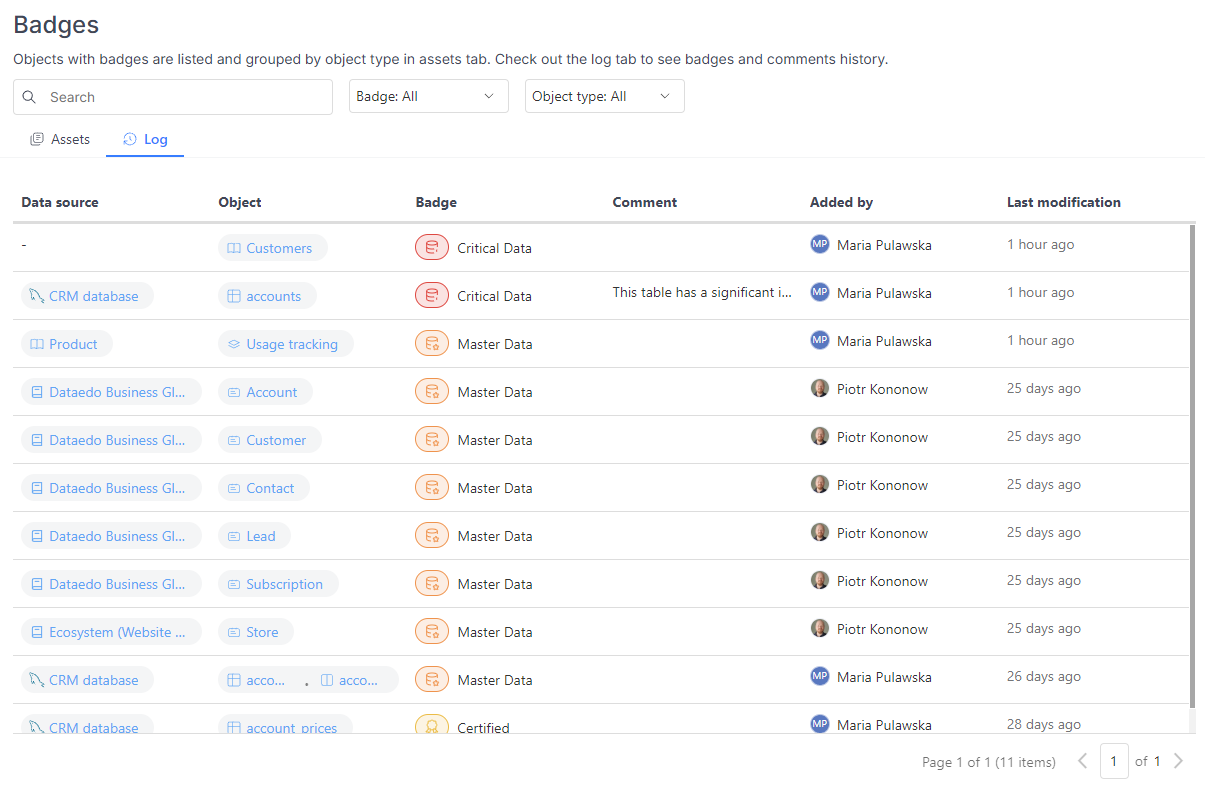
Each of these views also includes a "Log" tab, which displays a list of all badges assigned to the objects.
Creating and editing a badge
Admins can create custom badges to meet the organization's specific needs. To do so, they need to open the Catalog Settings and navigate to the 'Badges' tab.
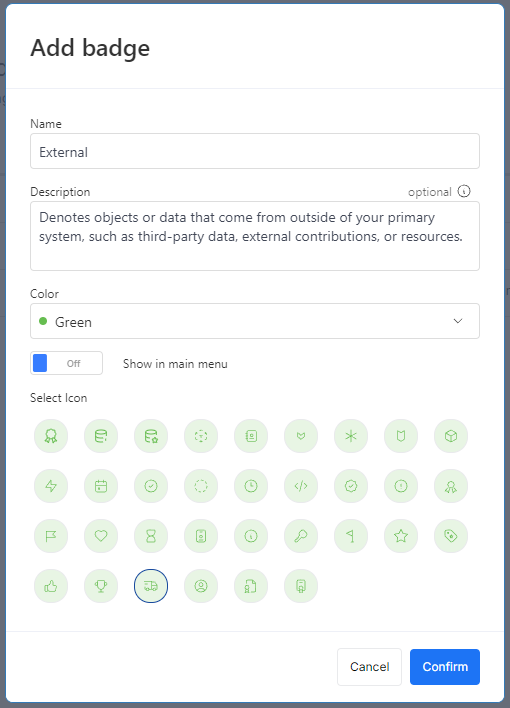
When creating a badge, the name, color, and icon are required. The 'Show in Main Menu' option determines whether a separate navigation item will appear under the Catalog. By default, 'Master Data' and 'Critical Data' are displayed in the navigation, along with a grouped section called 'Badges' that includes all created badges.
Managing menu order
The 'Show in Main Menu' option determines whether a separate navigation item will appear under the Catalog. By default, 'Master Data' and 'Critical Data' are displayed in the navigation, along with a grouped section called 'Badges' that includes all created badges.
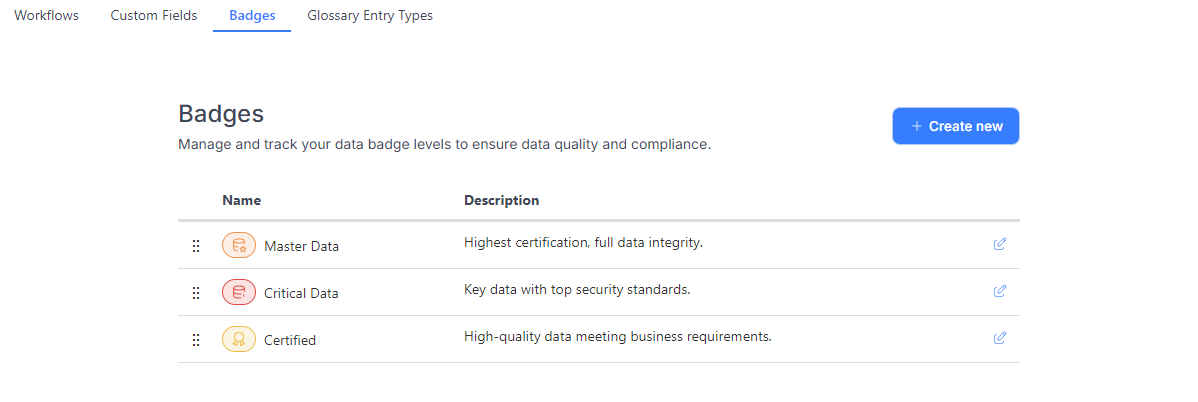
The order of items in the menu can be customized by dragging and dropping elements in the badges list within the settings.
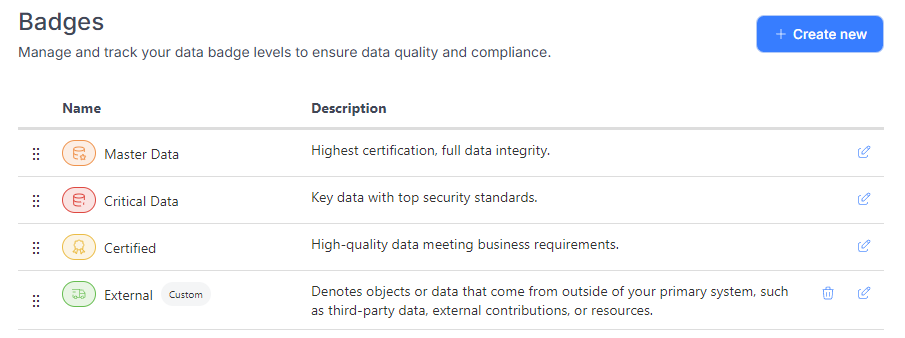
These settings above determine the order in which items appear in the navigation. Only 'Master Data' and 'Critical Data' have the 'Show in Main Menu' option enabled.
System level Lineage in Portal
We introduced a new menu item, 'Data Lineage,' that showcases an overview of your system, including all Data Sources and Reportings in the repository and their connections.
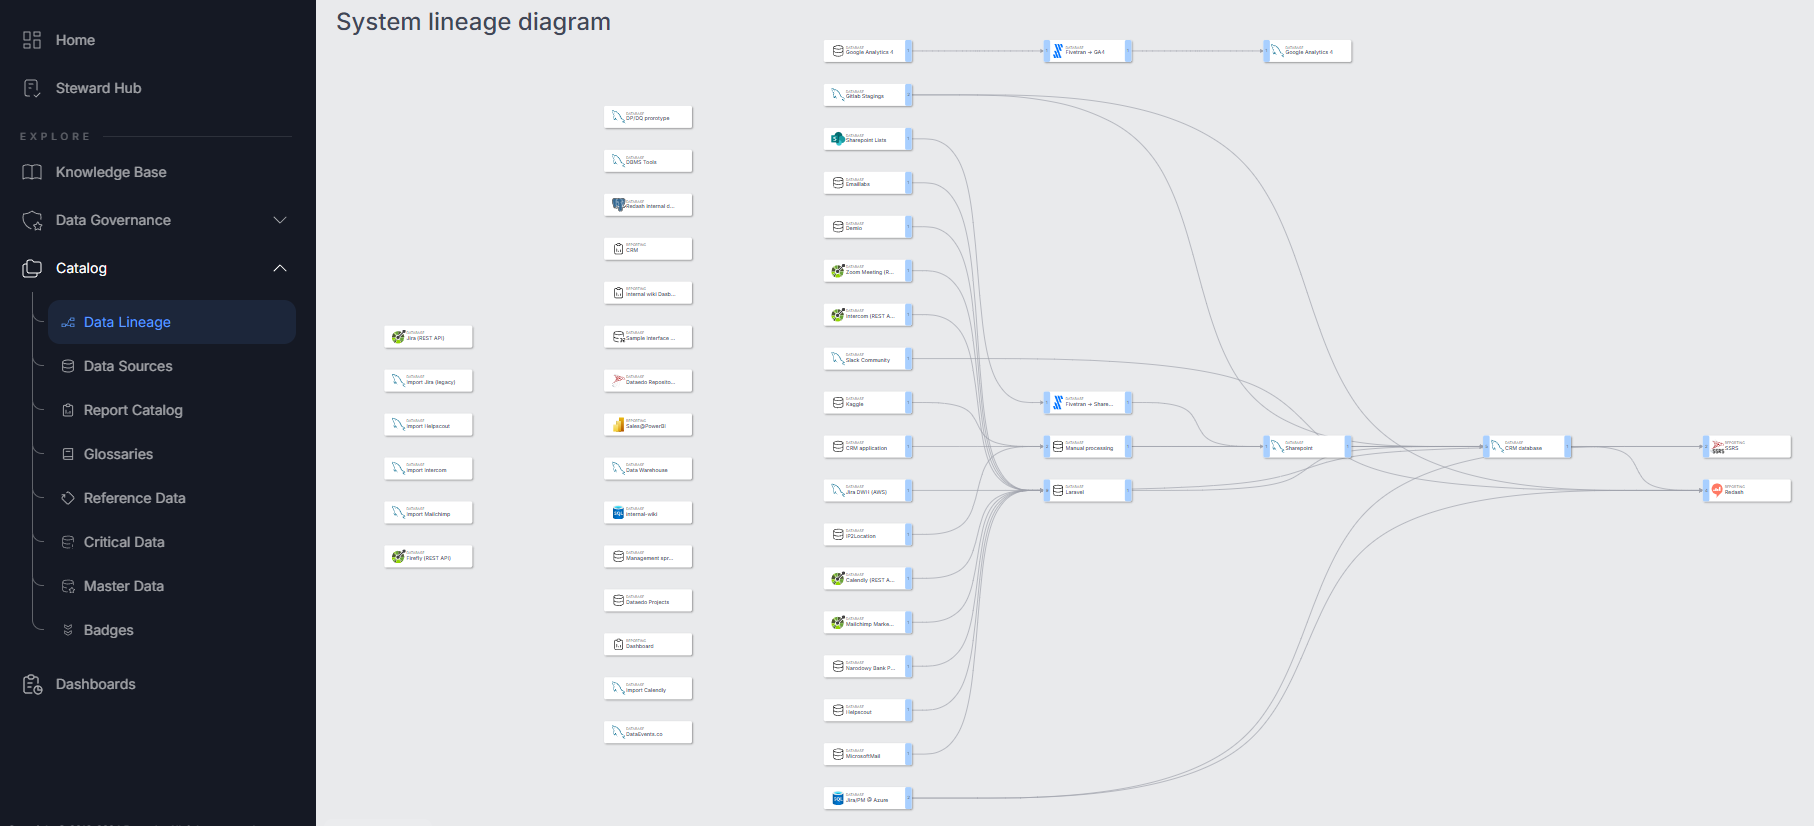
Hovering over a connection displays a tooltip with details about the number of internal connections between databases.

Please note that the numbers at both ends of the same connection may differ. For example, 129 objects (e.g. tables, views,...) on the left might be used in 639 objects (e.g. reports) on the right.
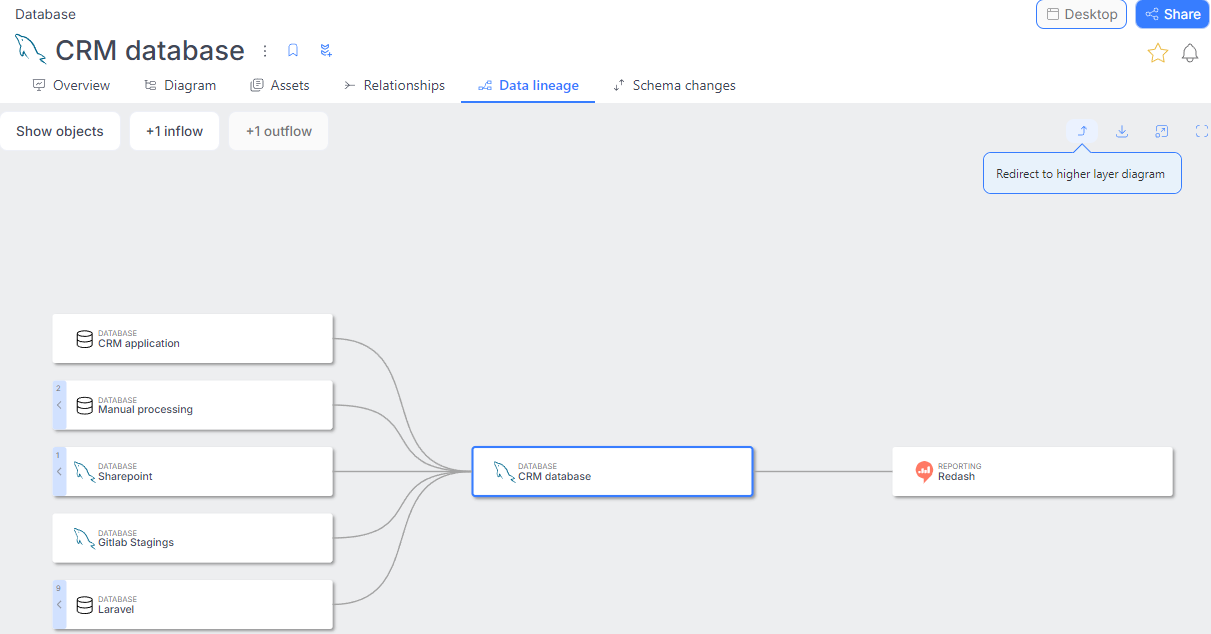
Users can also navigate from the source-level diagram to the system-level diagram using a dedicated button.
Custom Fields management via Portal
In this version, we're adding a configuration for custom fields to the Portal - previously, only pin and unpin options were available there. The full configuration used to only be available on the desktop, but now we're moving more and more features into the portal.
From now on, it's possible to add, edit, and remove custom fields directly in the portal. This feature is available to admins, who can find it under the "Custom Fields" tab in the catalog settings. The list is divided into two groups: pinned and other custom fields. The behavior stays the same—pinned fields will appear at the top of the object page, while the others will be at the bottom.
Adding a Custom Field
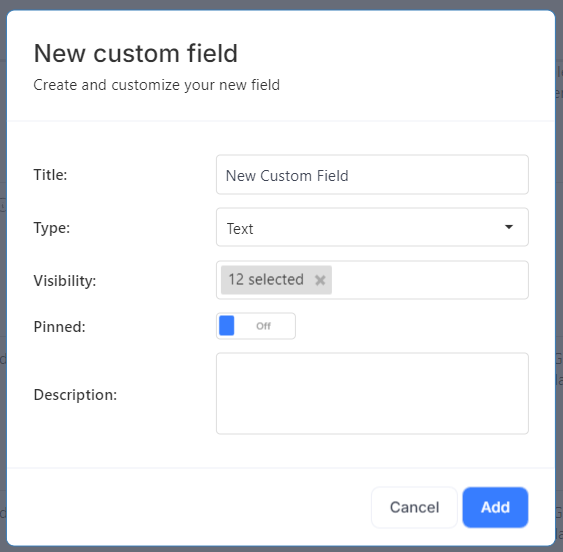
To create a new custom field, click the "Add Custom Field" button in the top right corner. A popup will appear with several fields to fill in:
- Title: The name of the custom field, which must be unique.
- Type: The type of field, such as a multiselect dropdown, user selection, or simple text field.
- Visibility: The object types for which this custom field should be visible.
- Pinned: Whether the field should appear at the top of the page (pinned) or can be placed at the bottom.
- Description: This is optional.
Editing and removing a Custom Field
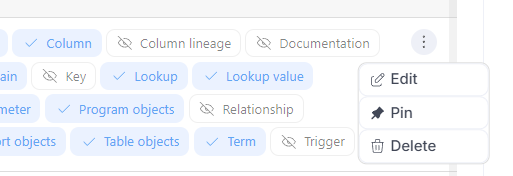
Each custom field can be edited, pinned, or removed using the "3 dots" menu on the right side. When editing, you can modify all properties: title, type, pin status, visibility, description, and definition.
Please note that editing or deleting custom fields may take some time, as these operations run in the background. Refreshing the list right away may show the old data for a given custom field.
Workflows improvements
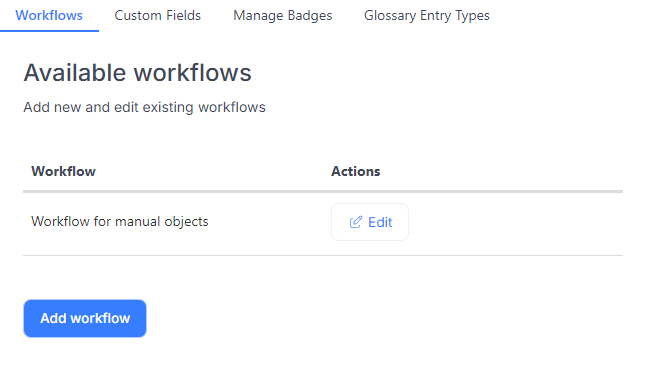
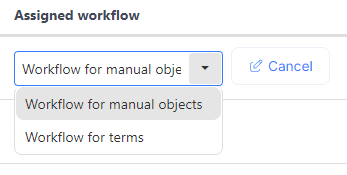
In version 24.2, we introduced the ability to create a single workflow for manual objects. In this latest version, we've expanded this feature to allow you to create multiple workflows. This is particularly useful if your organization's processes require different statuses for different object types.
To add another workflow, simply click the 'Add Workflow' button. The process for creating a new workflow is the same as it was previously.
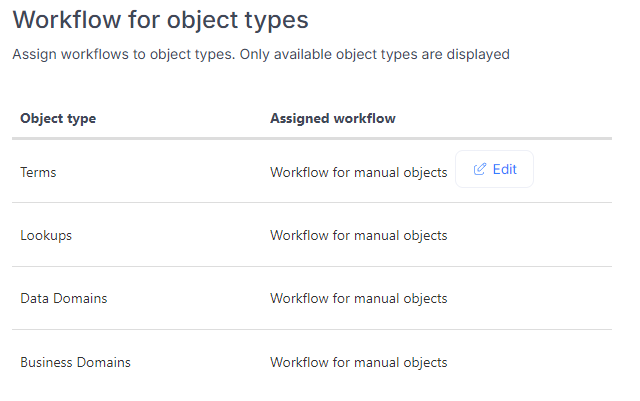
After creating a workflow, you can assign it to one of the object types. Each object type can have only one workflow assigned.
New connectors
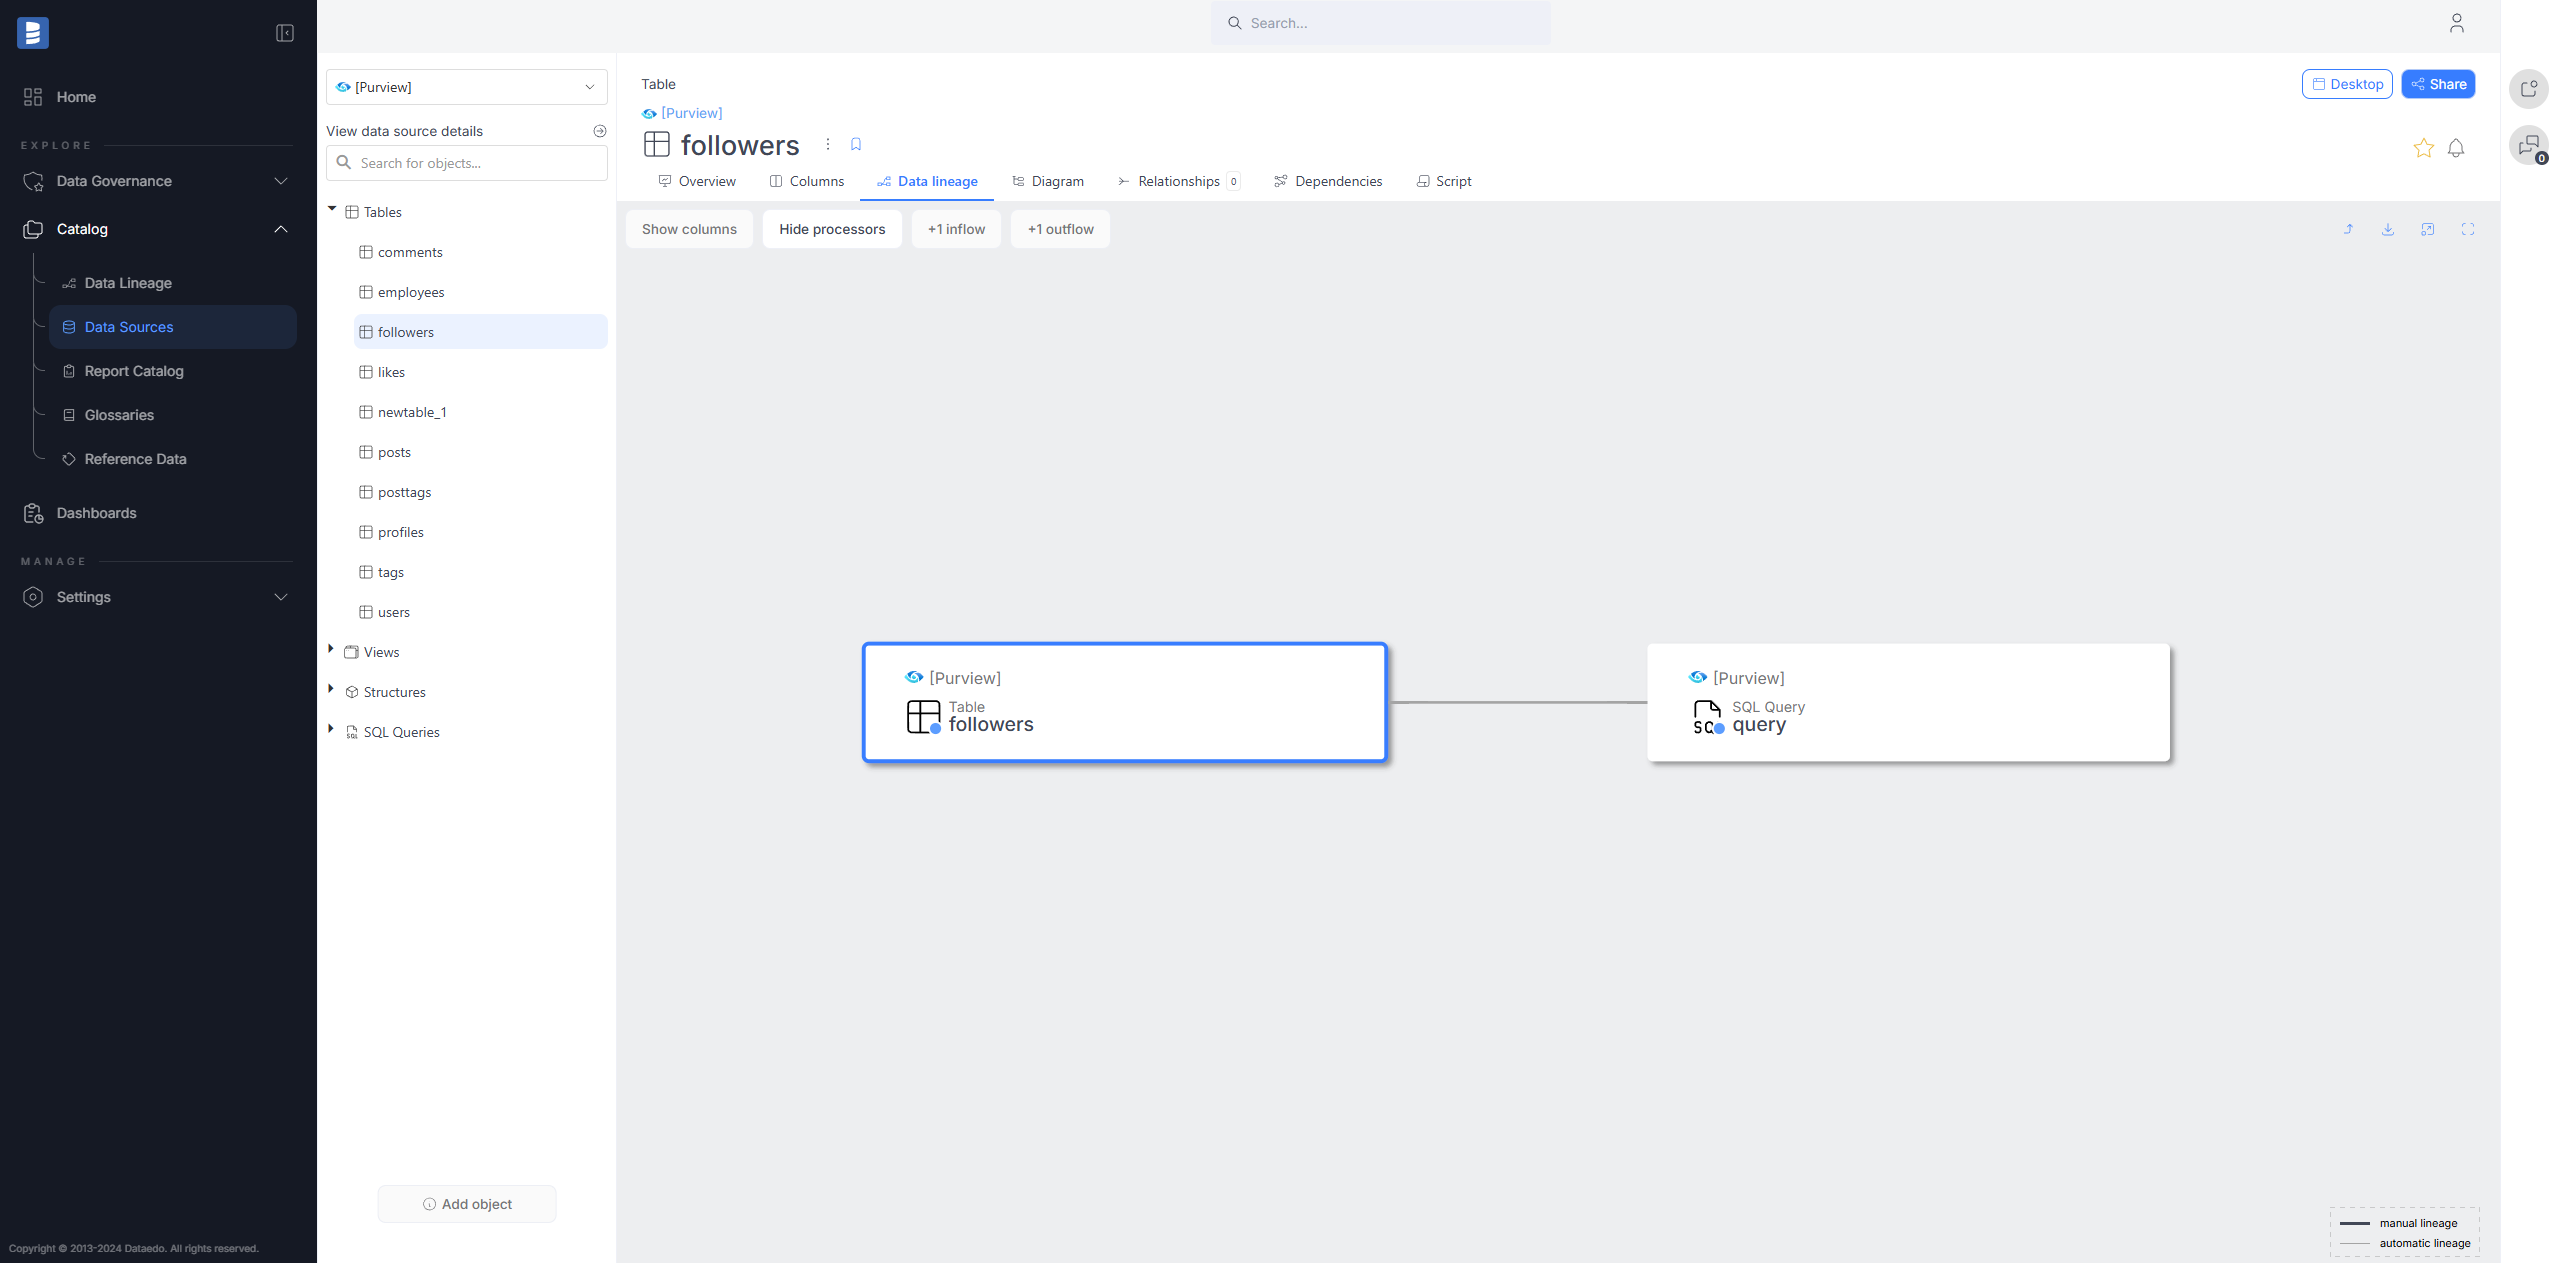
Microsoft Purview connector
Microsoft Purview is a unified data governance solution that enables organizations to catalog, manage, and discover data across their cloud and on-premises environments. Dataedo now supports Microsoft Purview as a data source, allowing you to import metadata from Purview and document it in Dataedo.
Read more details here.
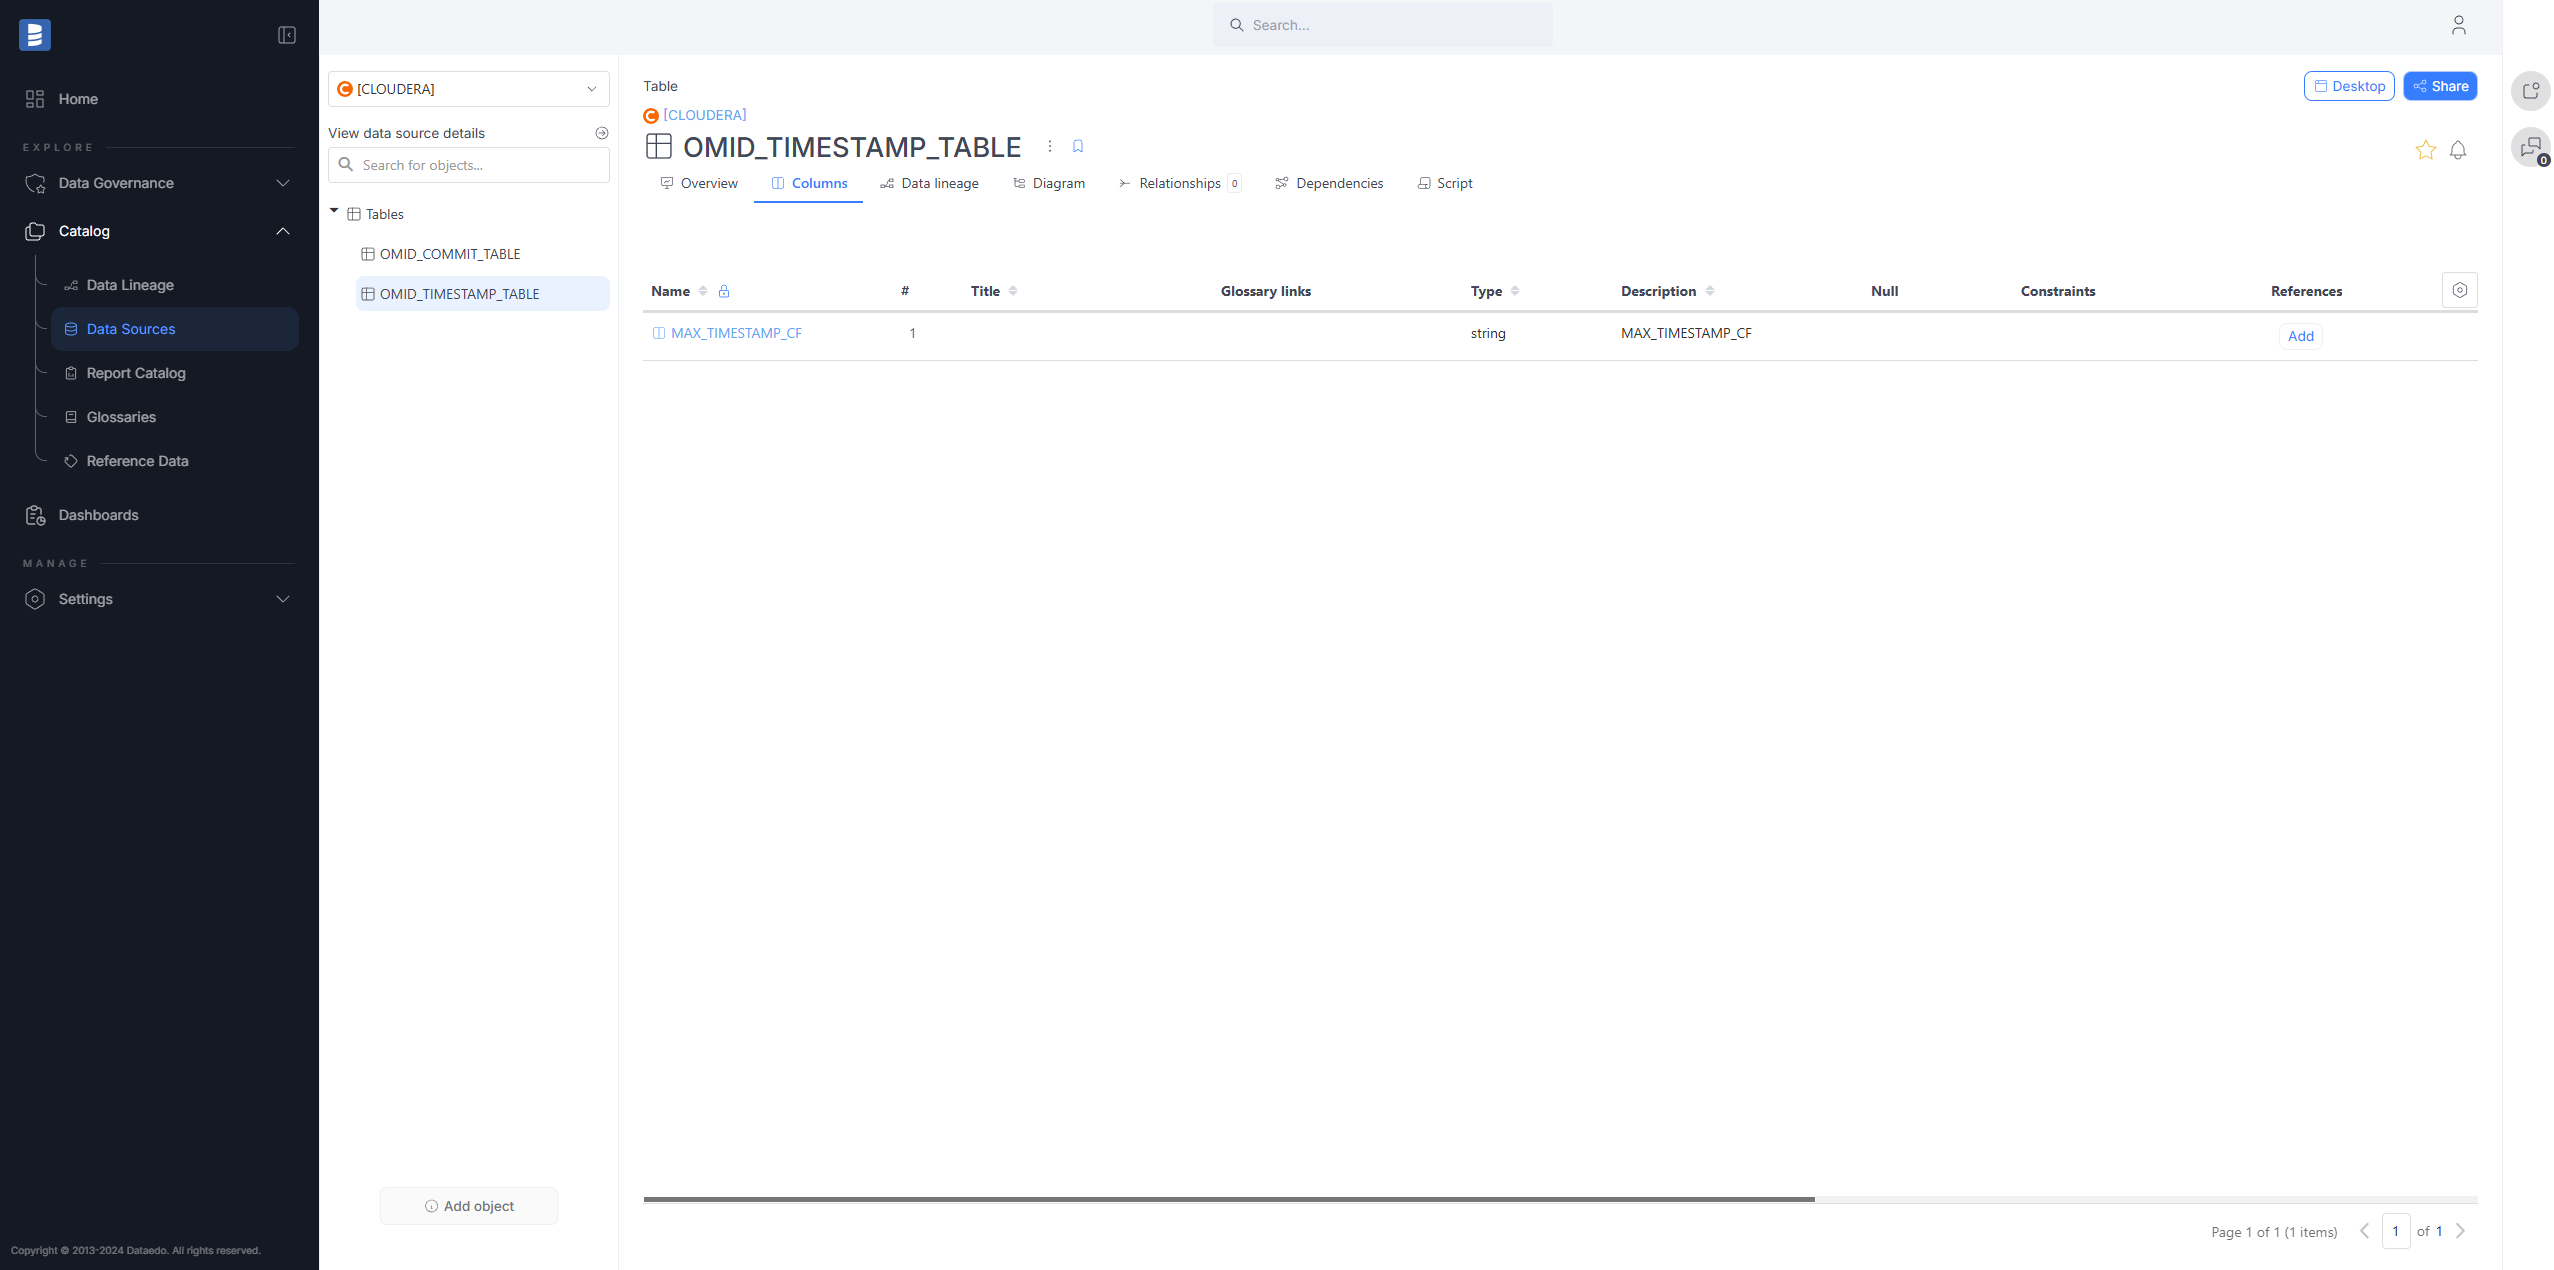
Cloudera connector
Cloudera Data Catalog is a comprehensive data governance tool designed for organizing, managing, and securing data assets within the Cloudera platform. Dataedo now supports Cloudera Data Catalog as a data source, allowing you to import metadata from Cloudera and document it in Dataedo.
Read more details here.
Connectors improvements
- Data Quality
- Badges
- System level Lineage in Portal
- Custom Fields management via Portal
- Workflows improvements
- New connectors
- Connectors improvements
- SQL Server Analysis Services (SSAS) Multidimensional data lineage improvements
- SQL Server Integration Services (SSIS) data lineage improvements
- SQL Server Reporting Services (SSRS) data lineage improvements
- Power BI data lineage improvements
- Azure Data Factory (ADF) improvements
- Salesforce descriptions
- SQL Parser and Data Lineage improvements
- Import speed improvement
- More Public API endpoints
- UX/UI improvements in Portal
- Keyword Explorer settings in Portal
SQL Server Analysis Services (SSAS) Multidimensional data lineage improvements
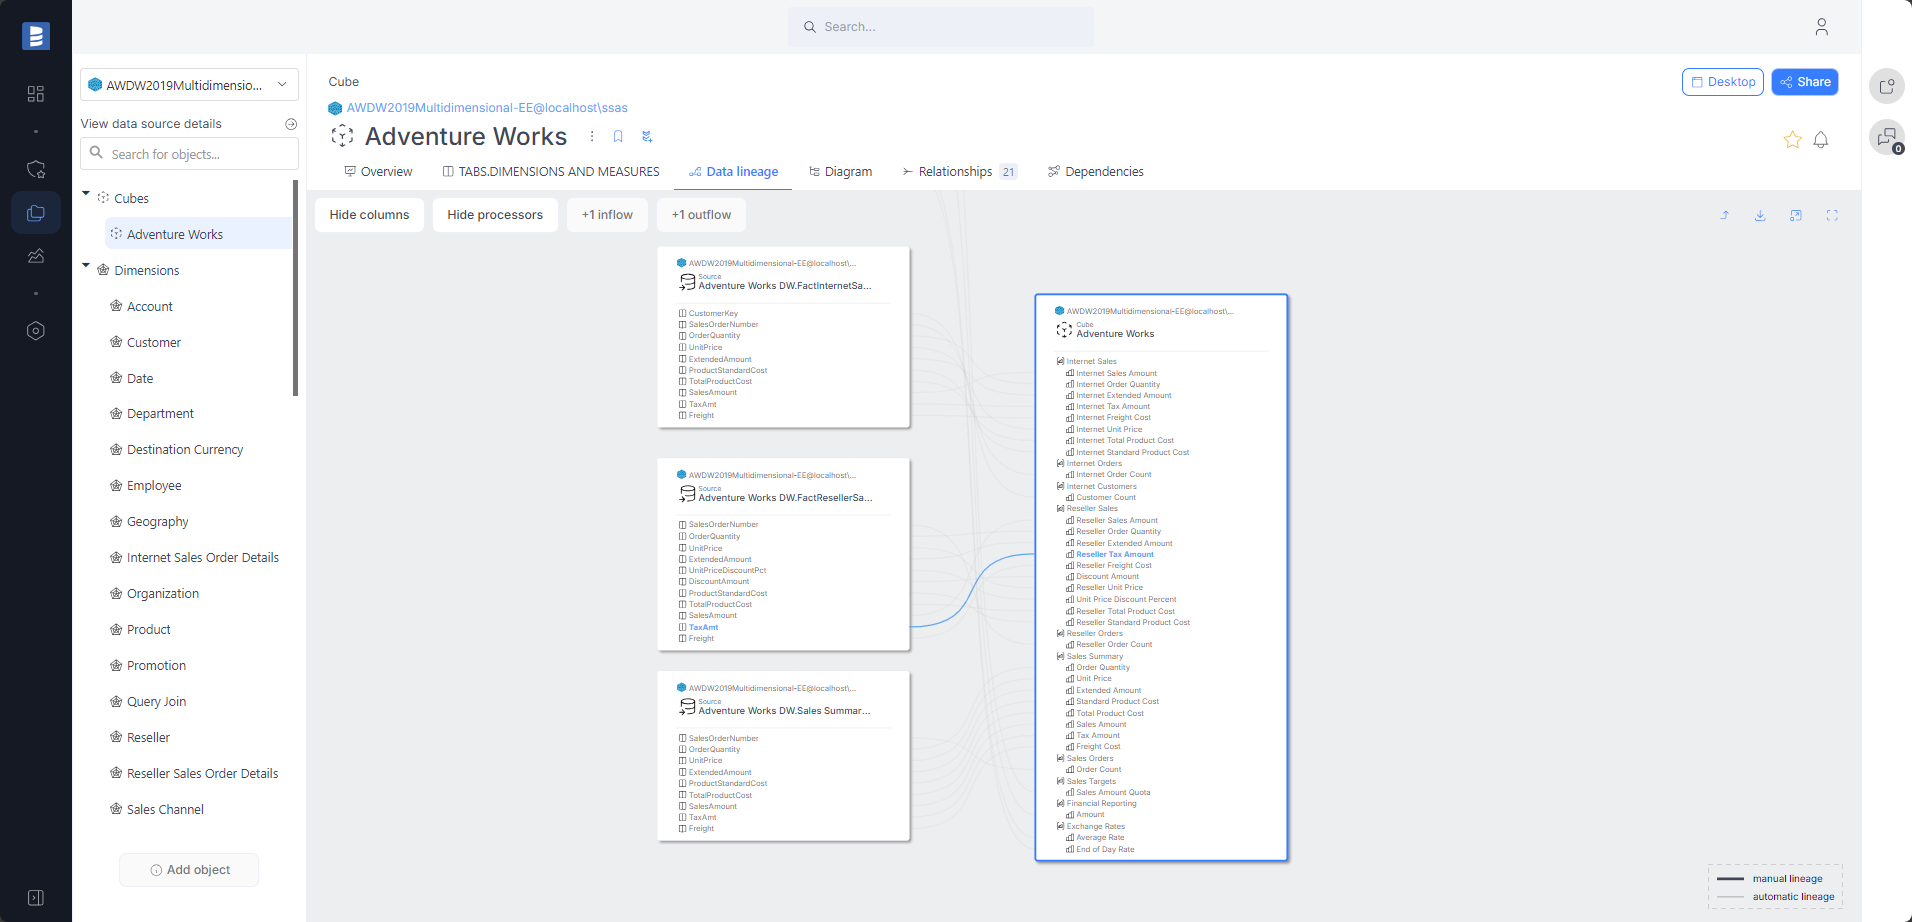
In version 24.4, the SSAS Multidimensional connector will automatically build lineage in Cubes. Data lineage will be built between measures and source columns.
Read more details here.
SQL Server Integration Services (SSIS) data lineage improvements
In version 24.4, we enhanced SSIS automatic lineage.
Dataedo now traces the entire path of each column transformation in the SSIS package. This heavily improves the quality of the lineage and makes it much more detailed.
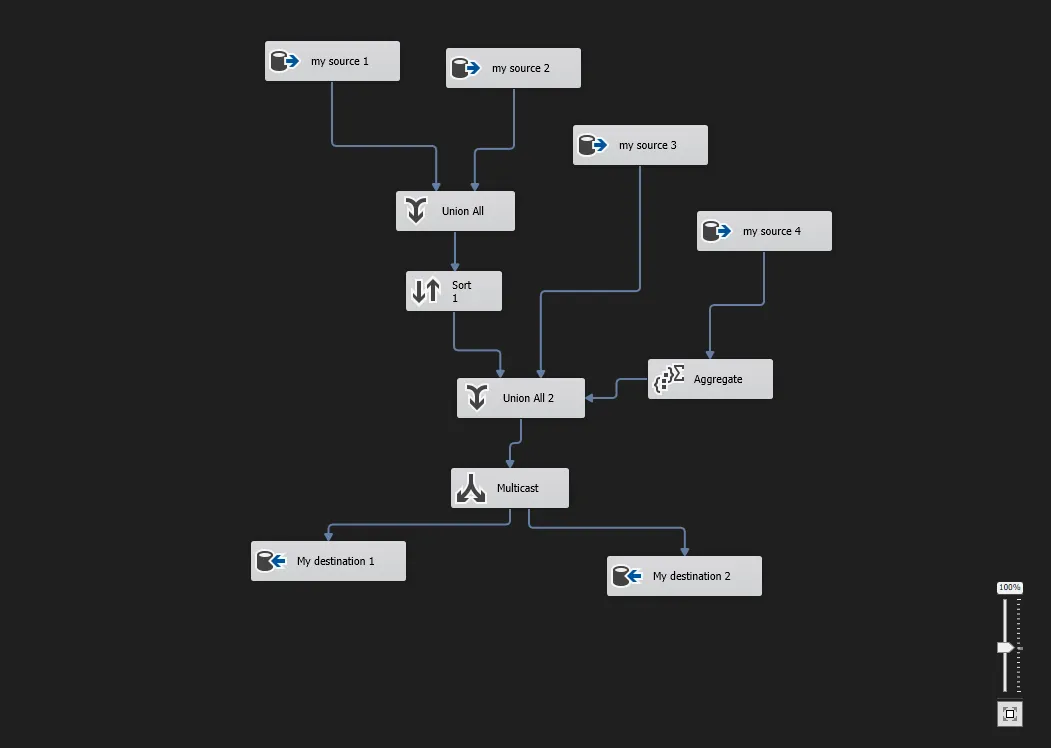
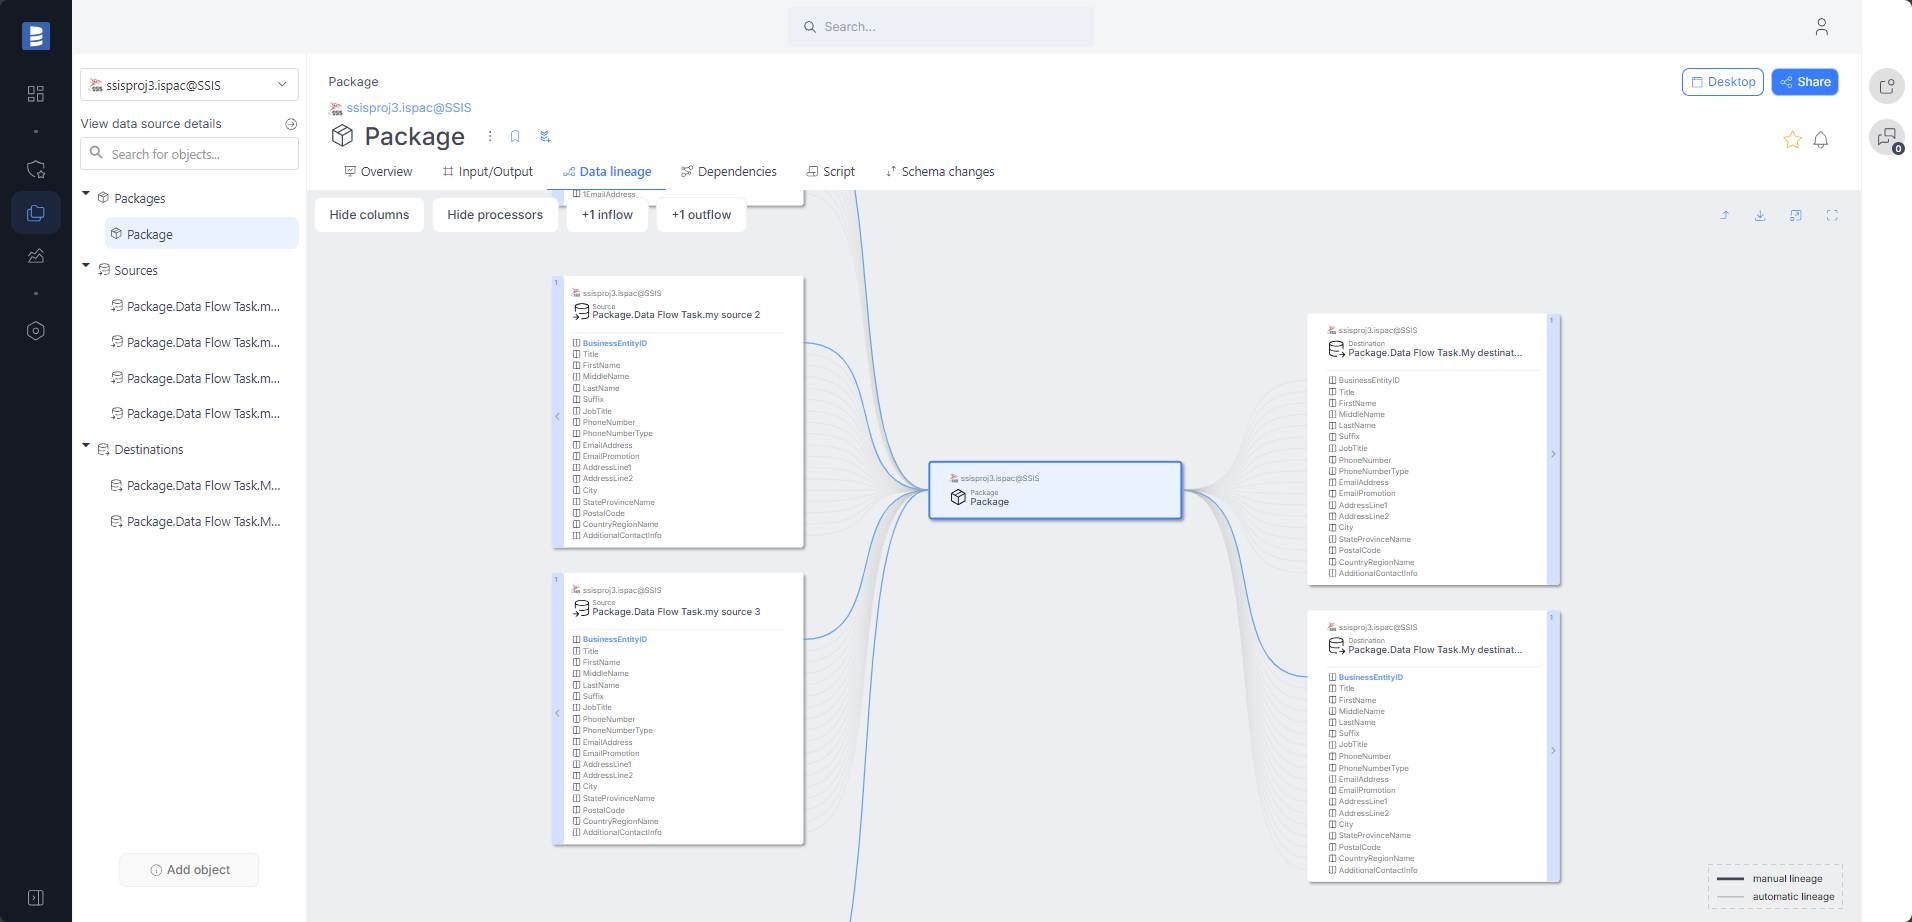
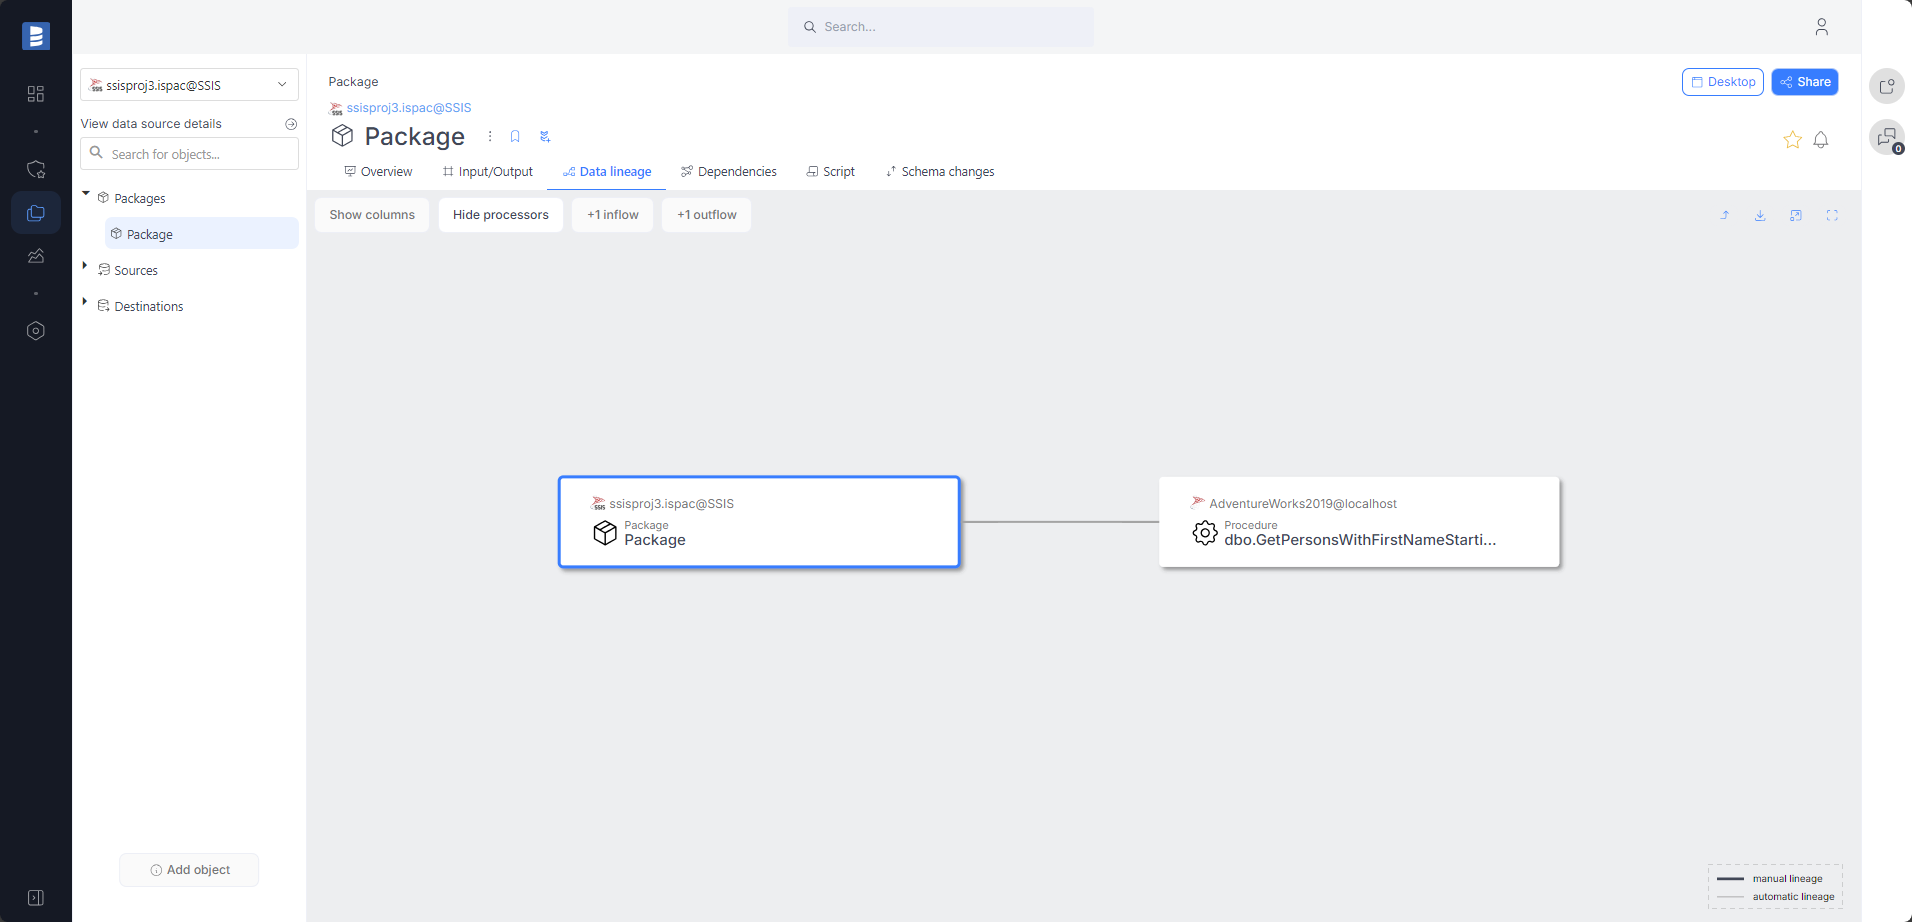
For "Execute SQL Task" tasks that call a procedure, an automatic lineage to that procedure will be created during the import process.
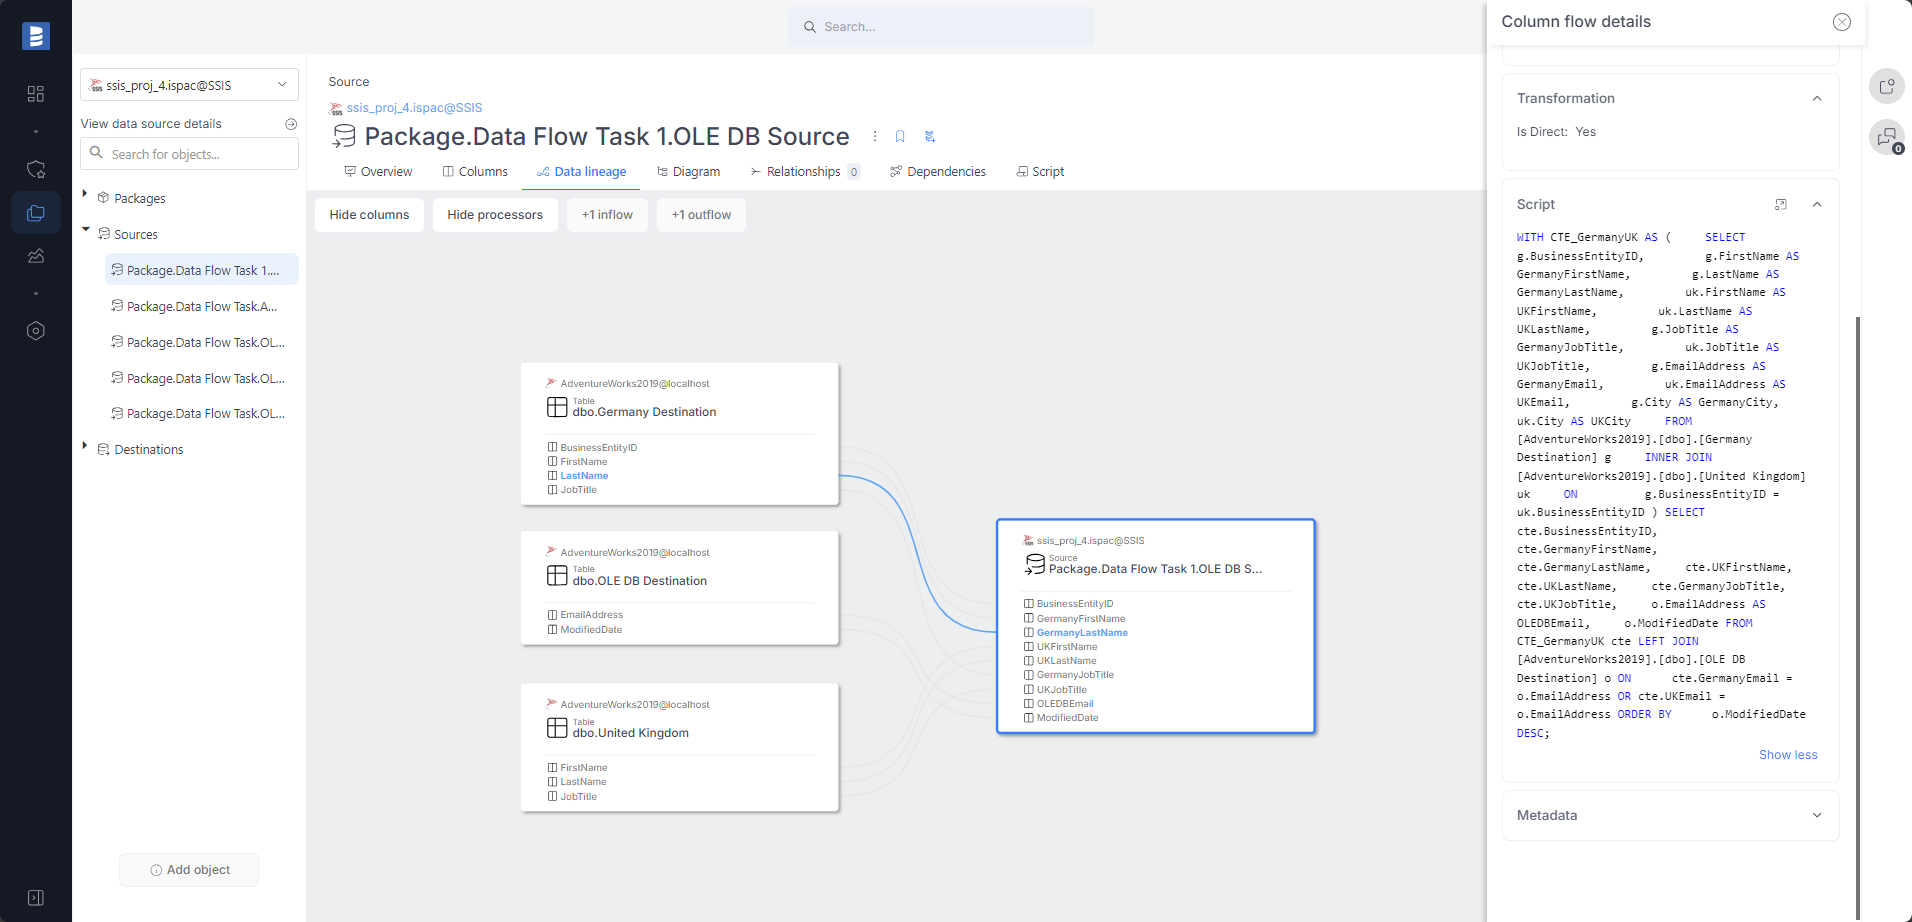
Automatic column-level data lineage for sources created from SQL queries. Thanks to our advanced SQL parser, lineage is created for very complex queries.
Read more details here.
SQL Server Reporting Services (SSRS) data lineage improvements
We added a column-level data lineage between the dataset table and the tables called in the procedure used by the dataset.
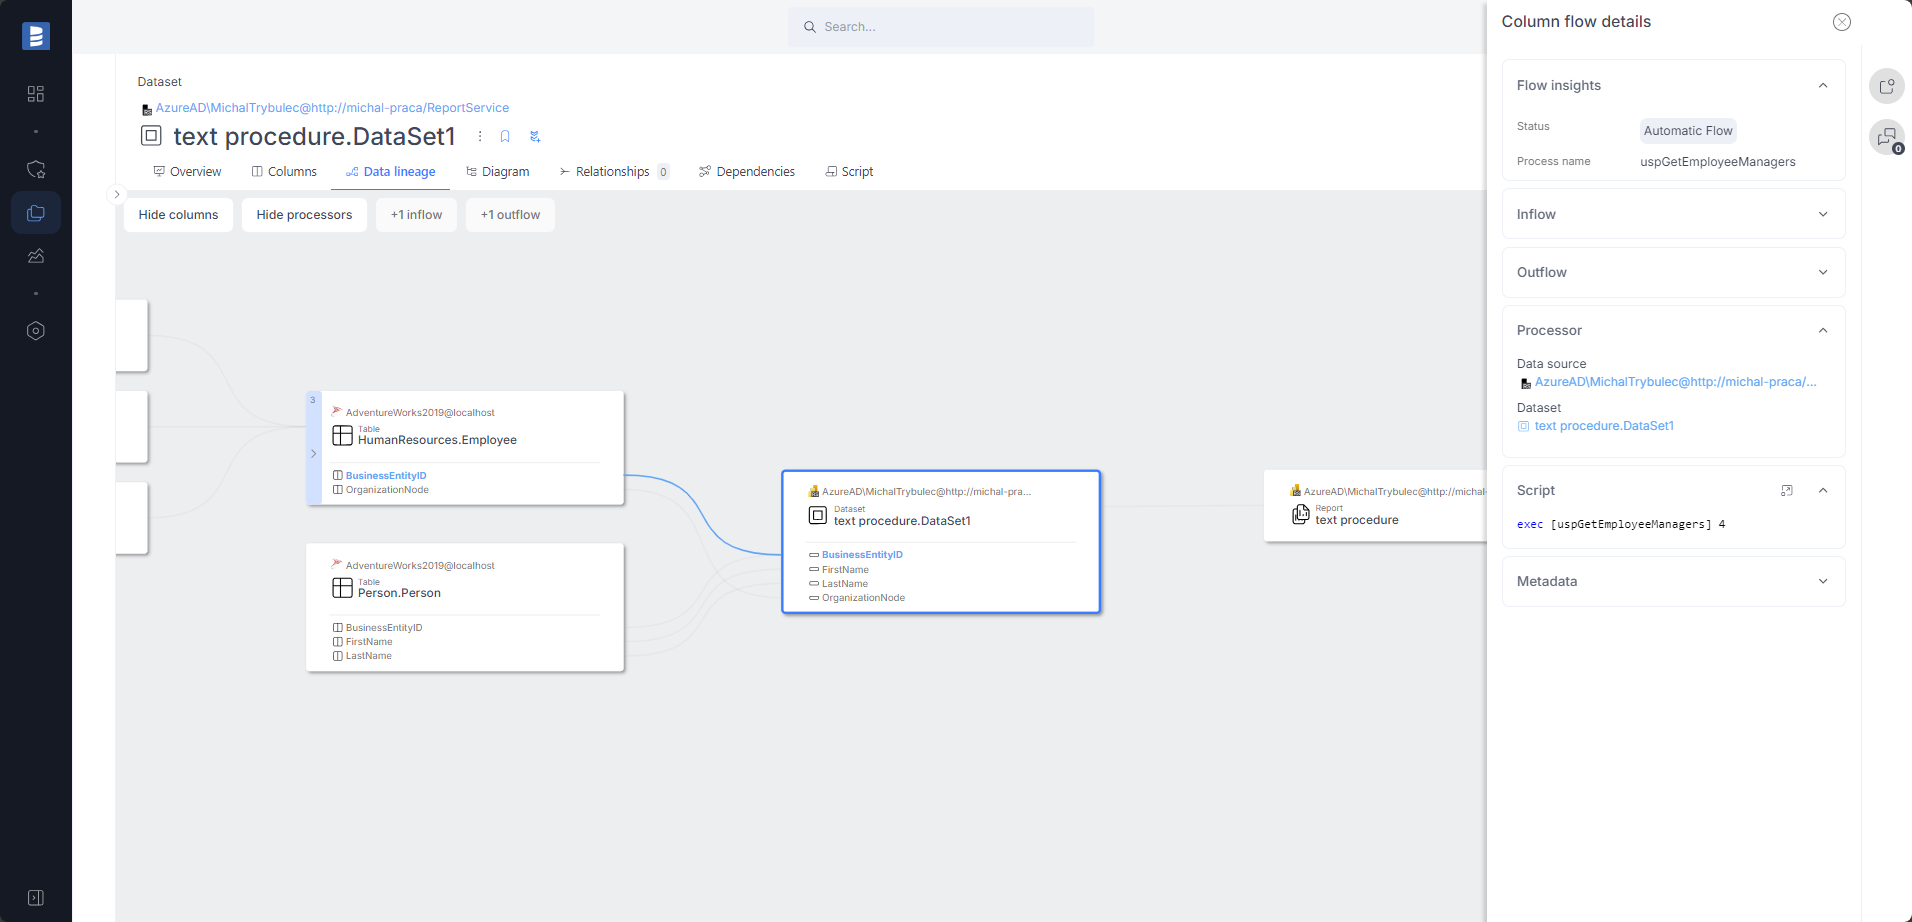
Power BI data lineage improvements
In version 24.4, the Power BI connector gained another automatic data lineage enhancement.
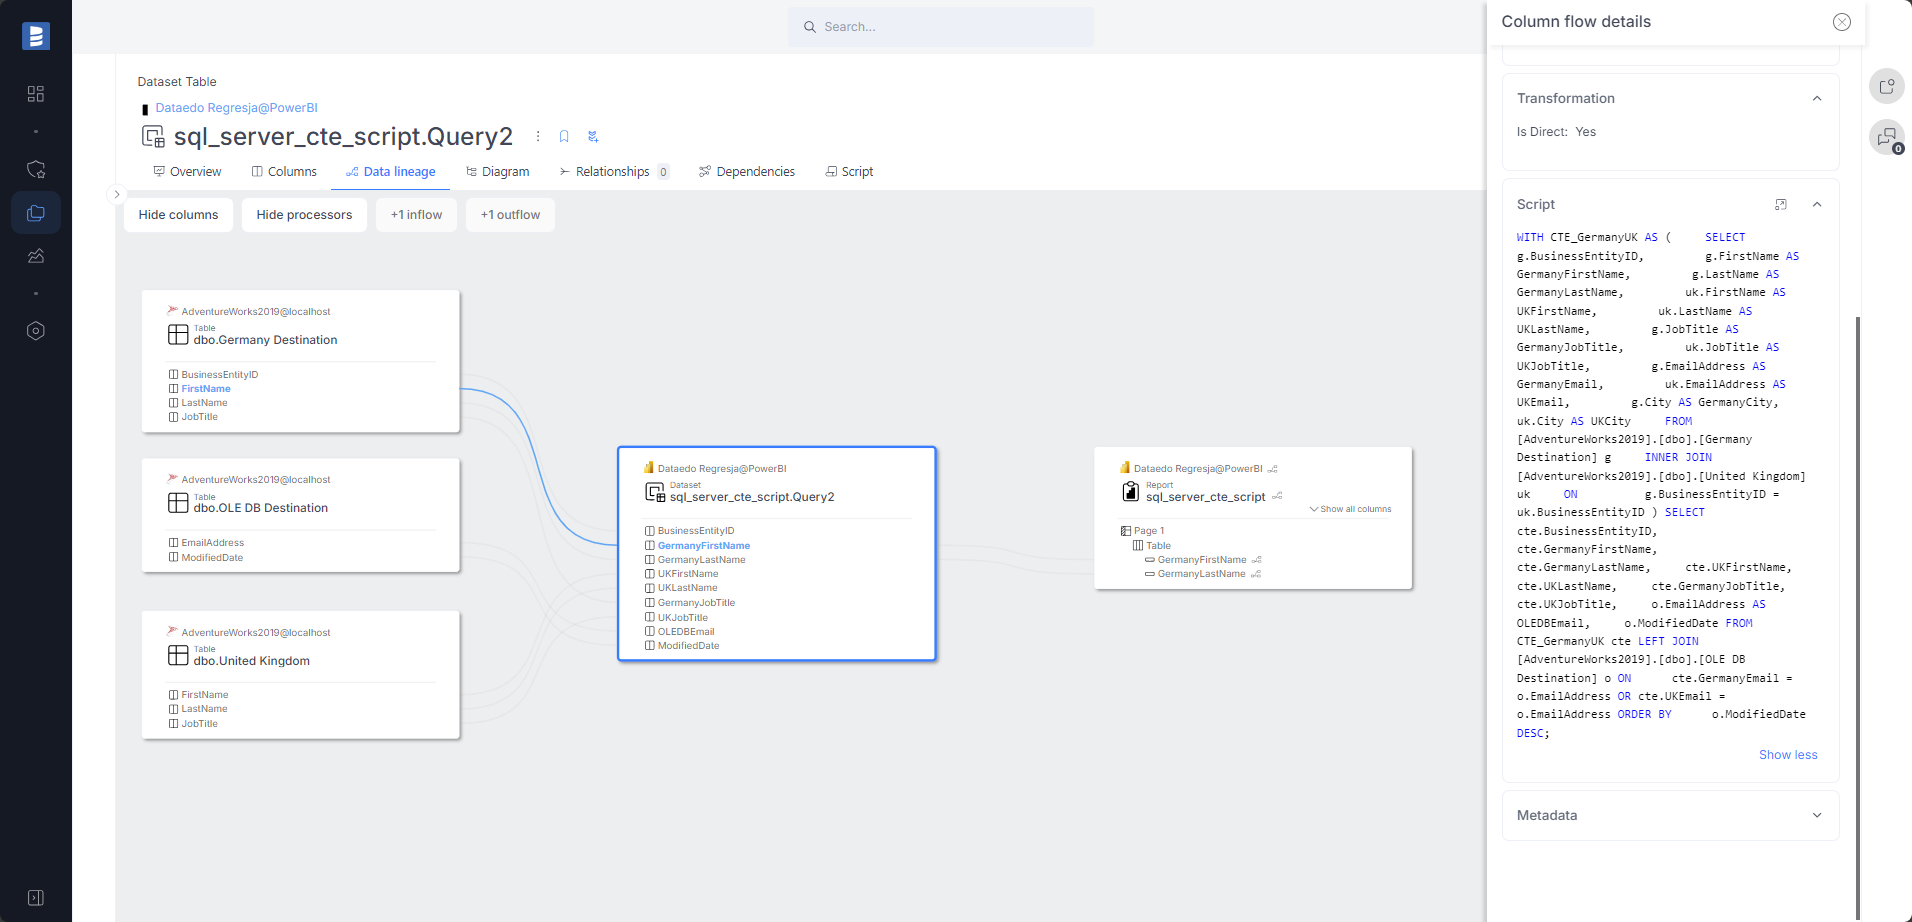
Automatic column-level data lineage for datasets created from SQL queries. Thanks to our advanced SQL parser, lineage is made for very complex queries.
Clearer data lineage for datasets with multiple sources. Thanks to the context-aware data lineage engine, each dataset table has individual lineage (instead of one lineage for the whole dataset).
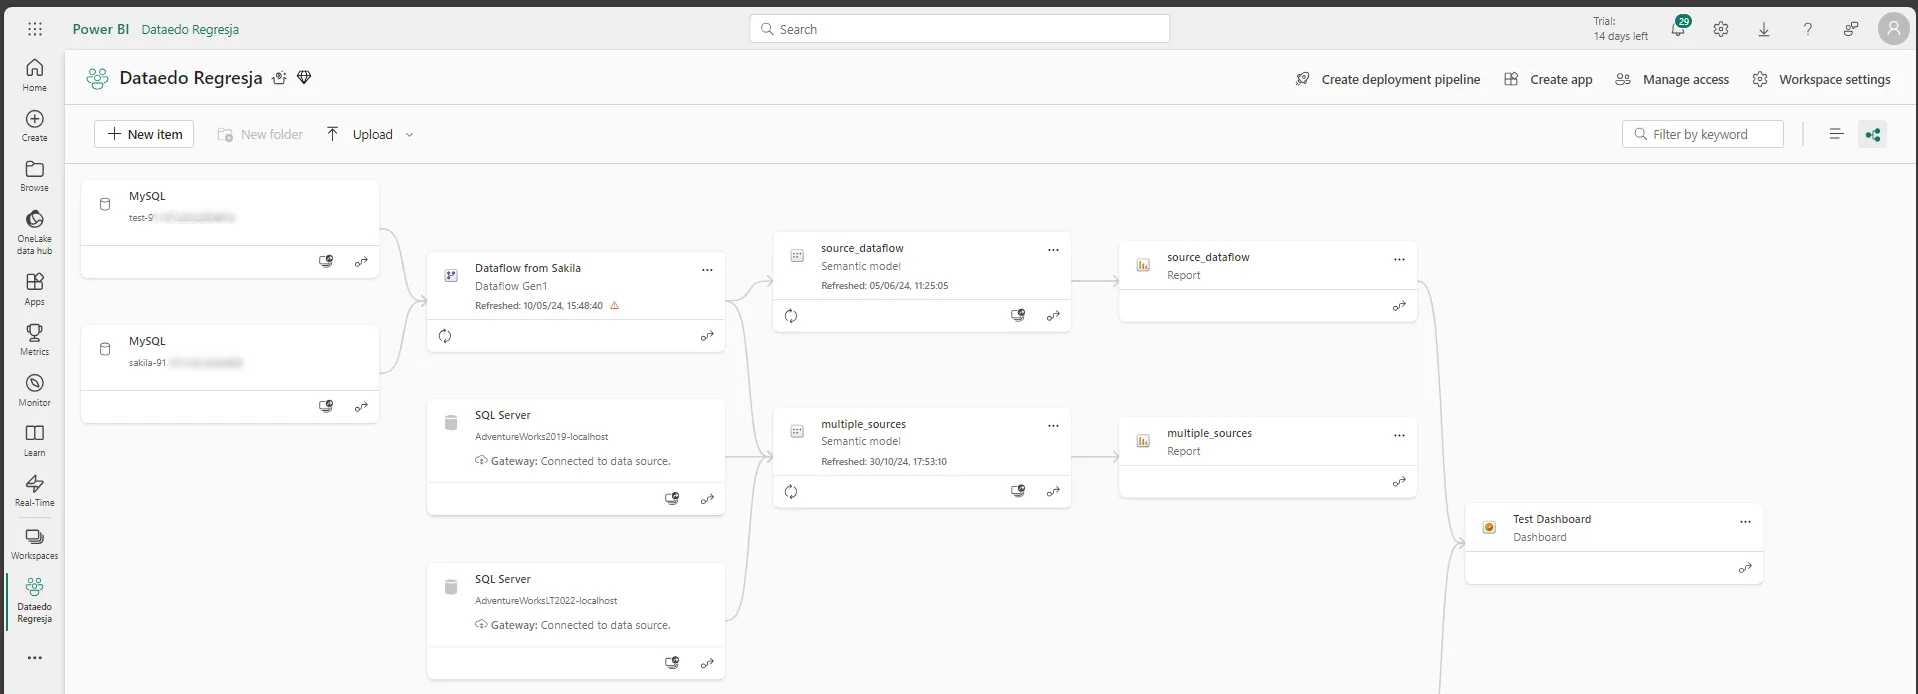
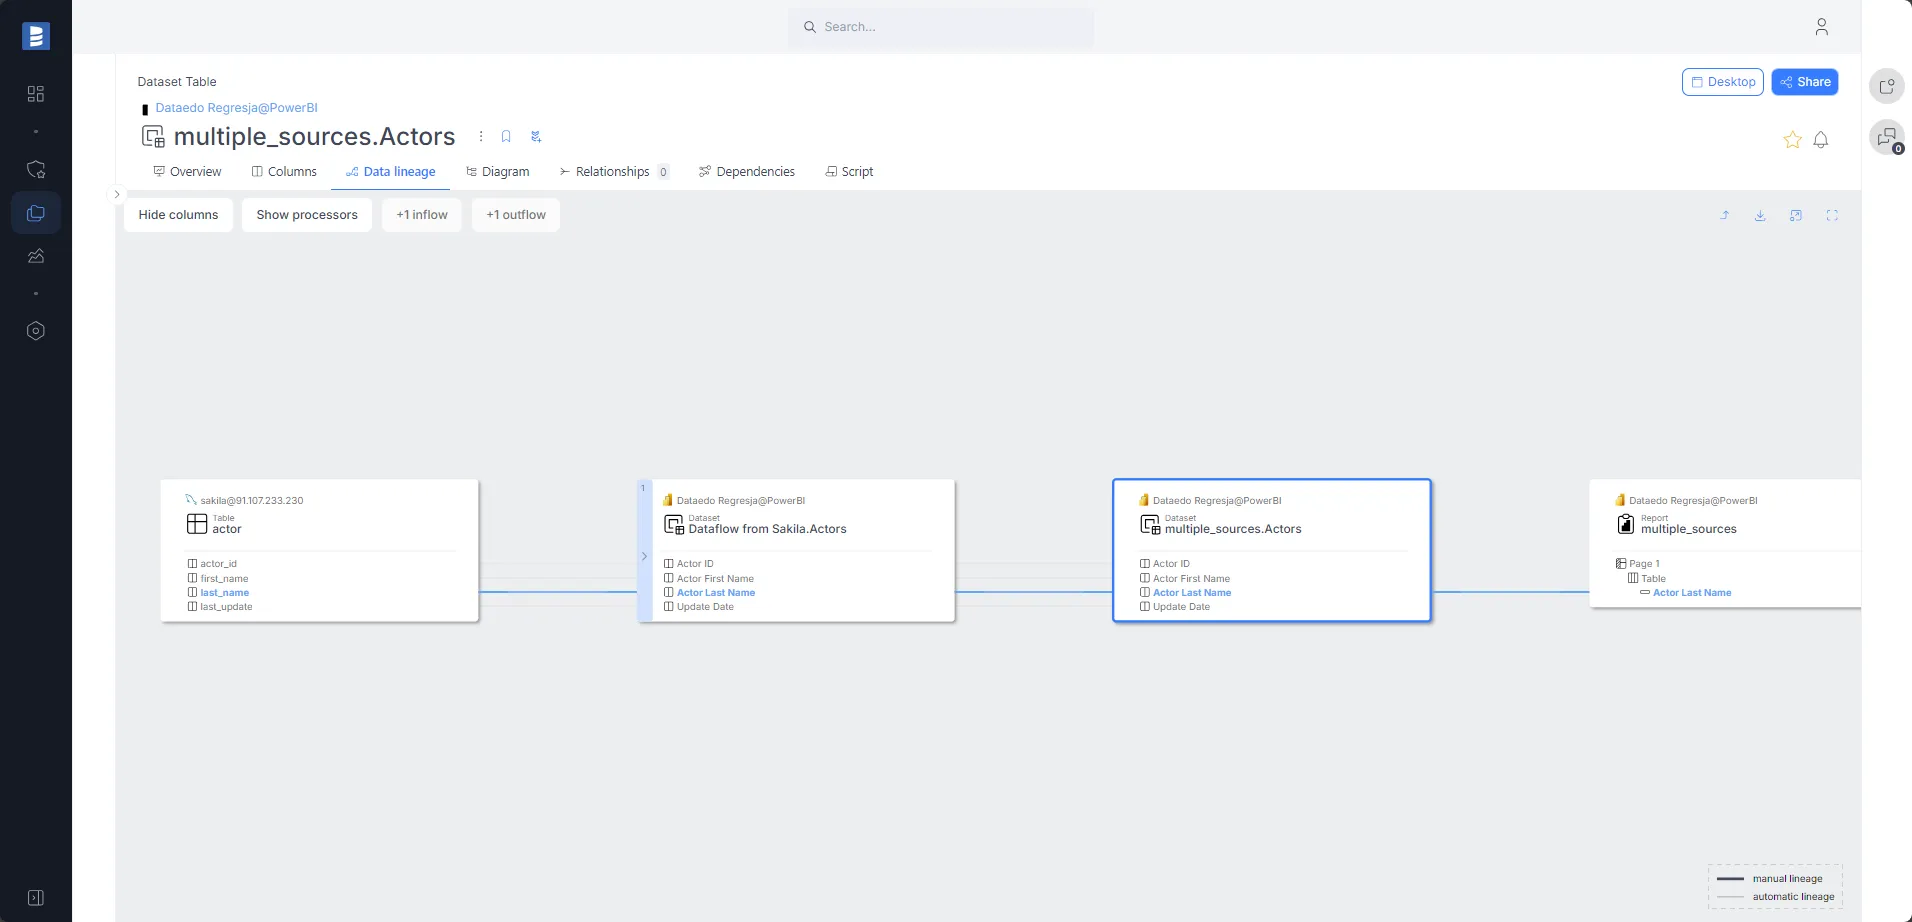
As you can see, the data lineage in Dataedo is much clearer and more detailed than in Power BI.
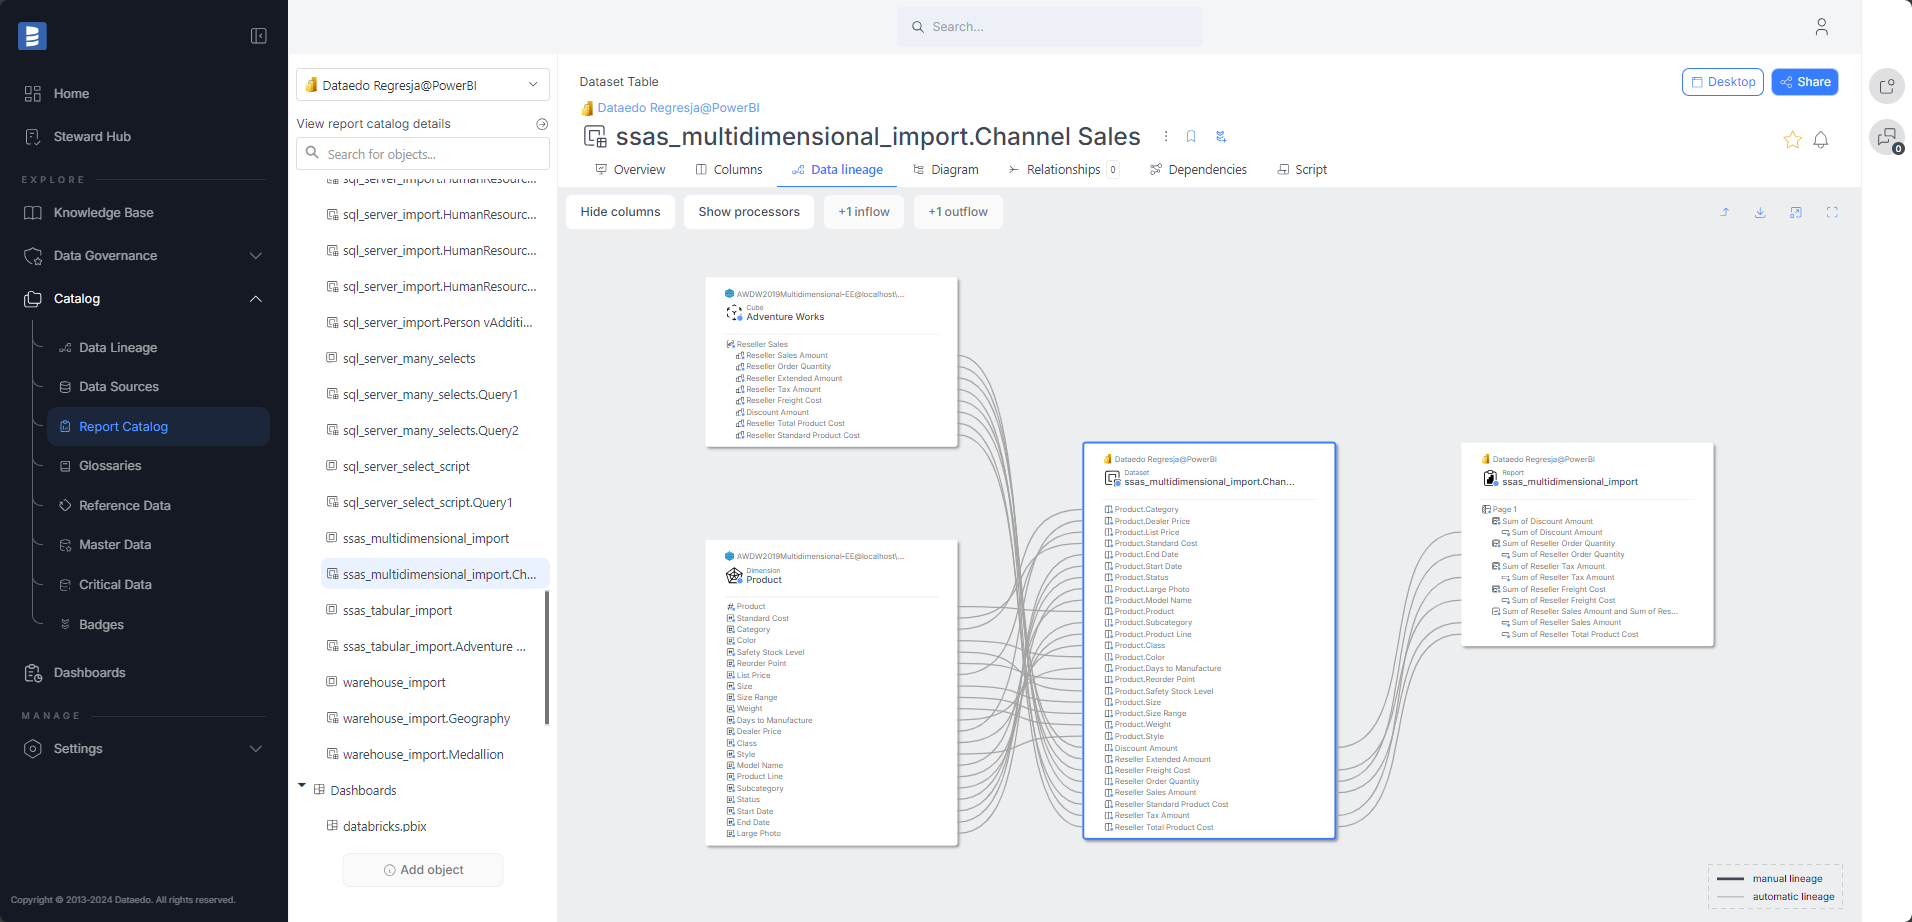
Support for an automatic column-level data lineage when SSAS Multidimensional is used as a source of Power BI dataset:
Read more details here.
Azure Data Factory (ADF) improvements
In 24.4 we added support for REST objects:
- The Azure Data Factory REST Linked Service is imported into Dataedo as a Linked Source and automatically mapped to the imported Dataedo OpenAPI/Swagger data source based on the hostname.
- The Azure Data Factory REST dataset is imported into Dataedo as a dataset (and source), with automatic object-level lineage established for the imported Dataedo OpenAPI/Swagger data source using the hostname and REST method name.
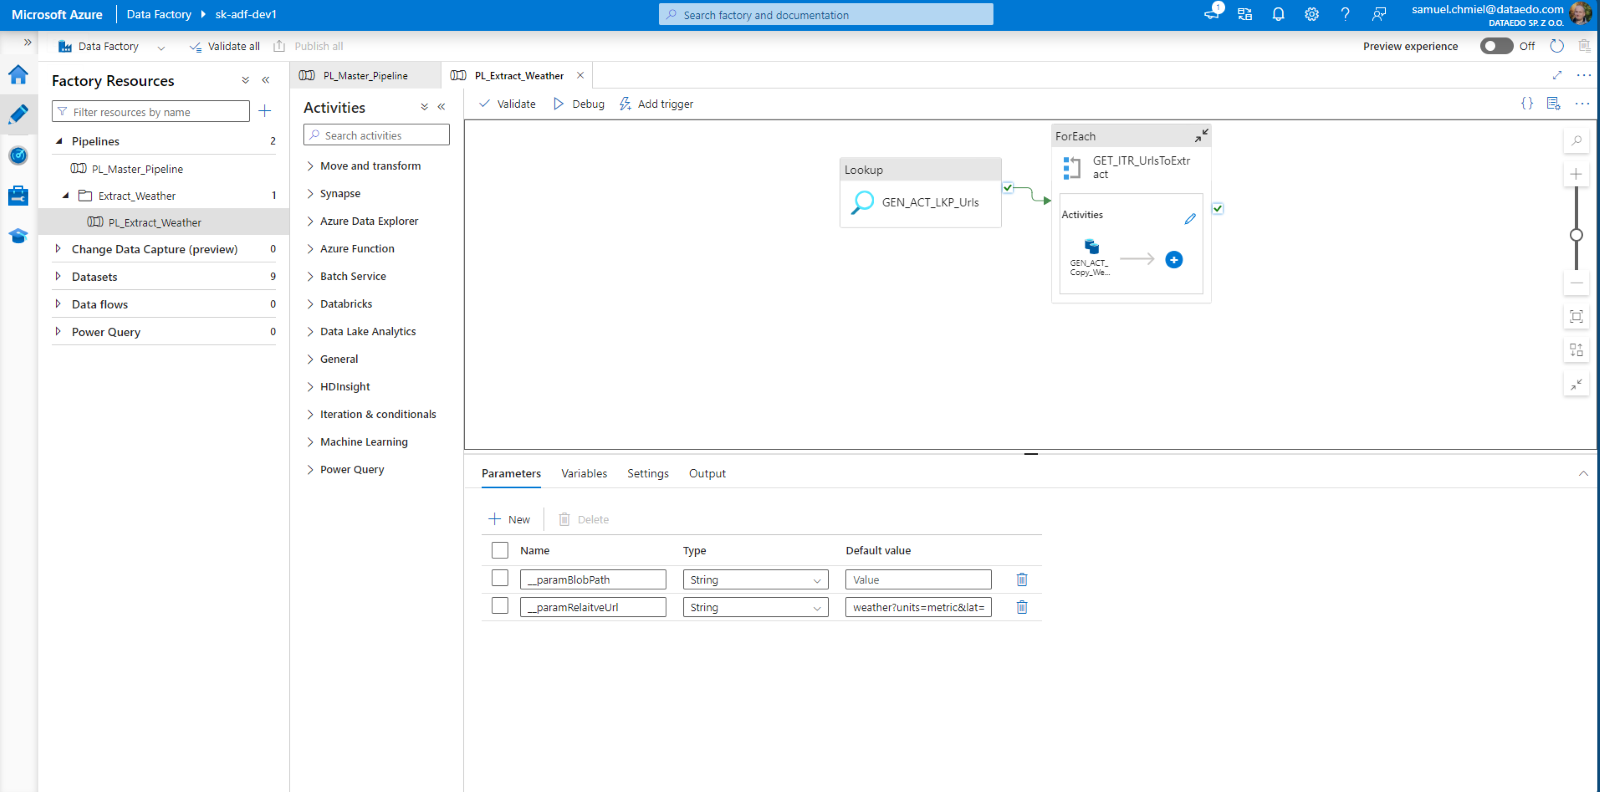
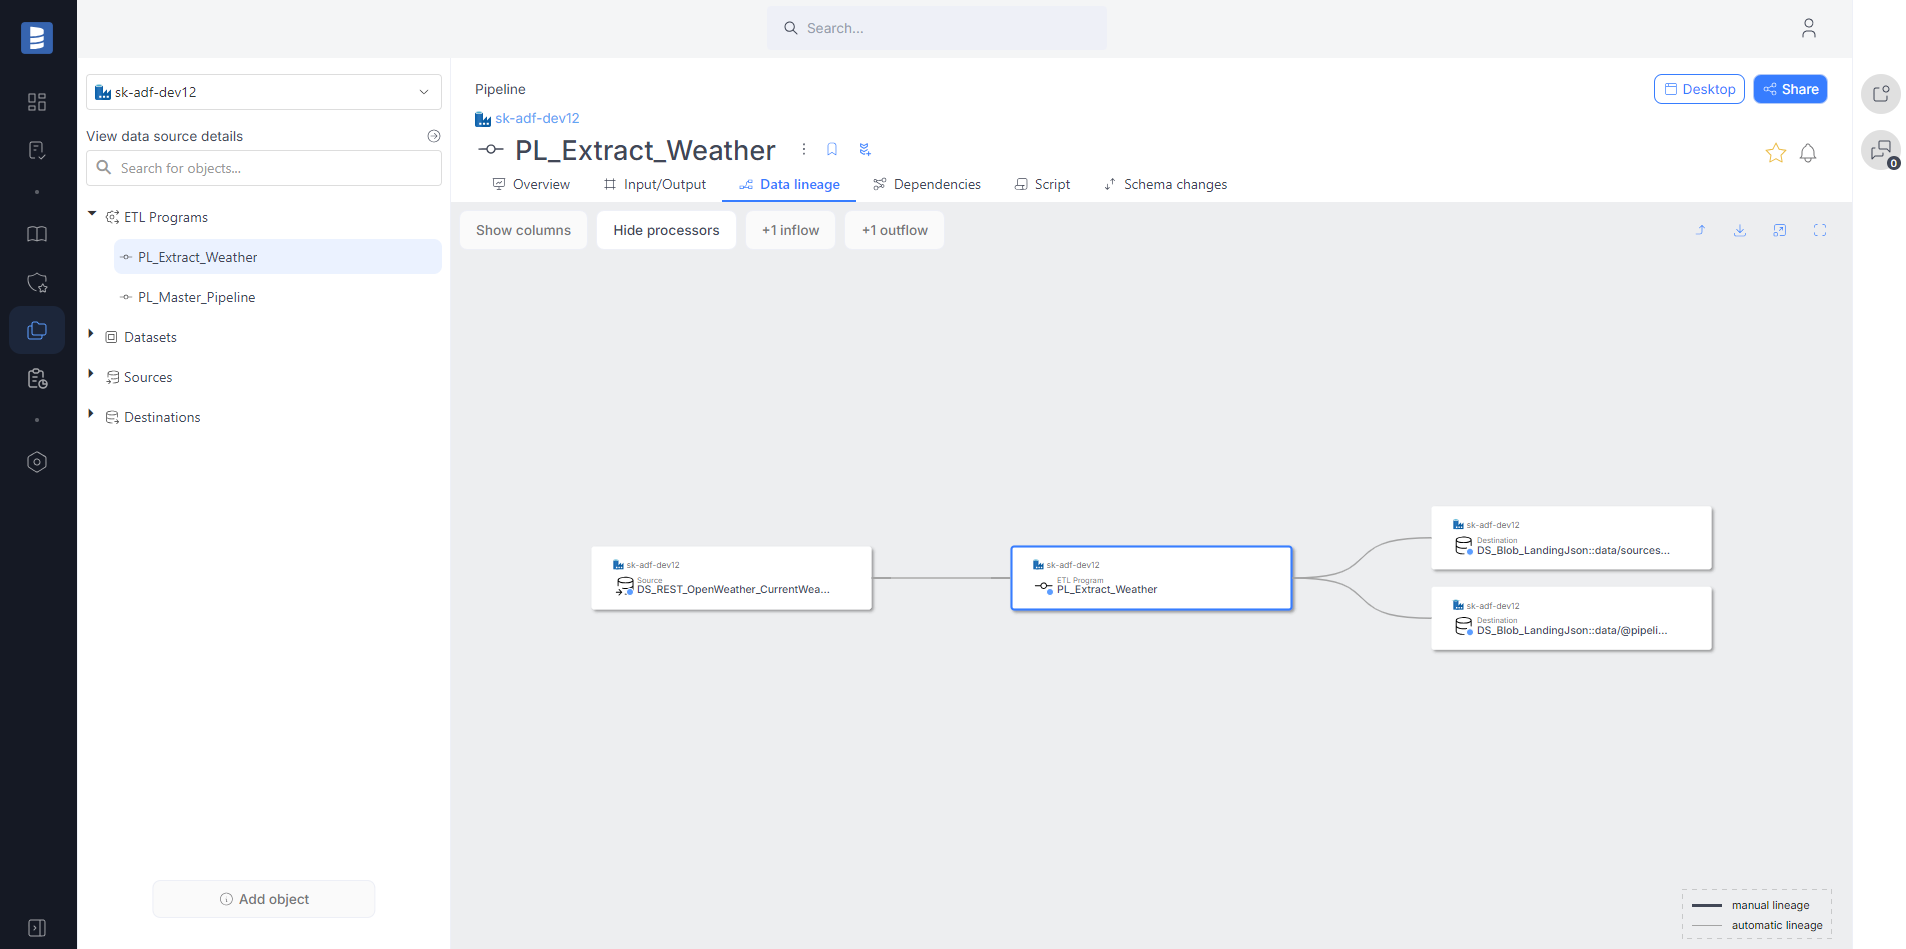
Azure Expressions Language support was significantly improved. We improved the pipeline and activity runs analysis with Azure Expressions Language interpretation. Currently supported functions: concat, toLower, utcnow, and string interpolations. Examples of expressions that are now supported:
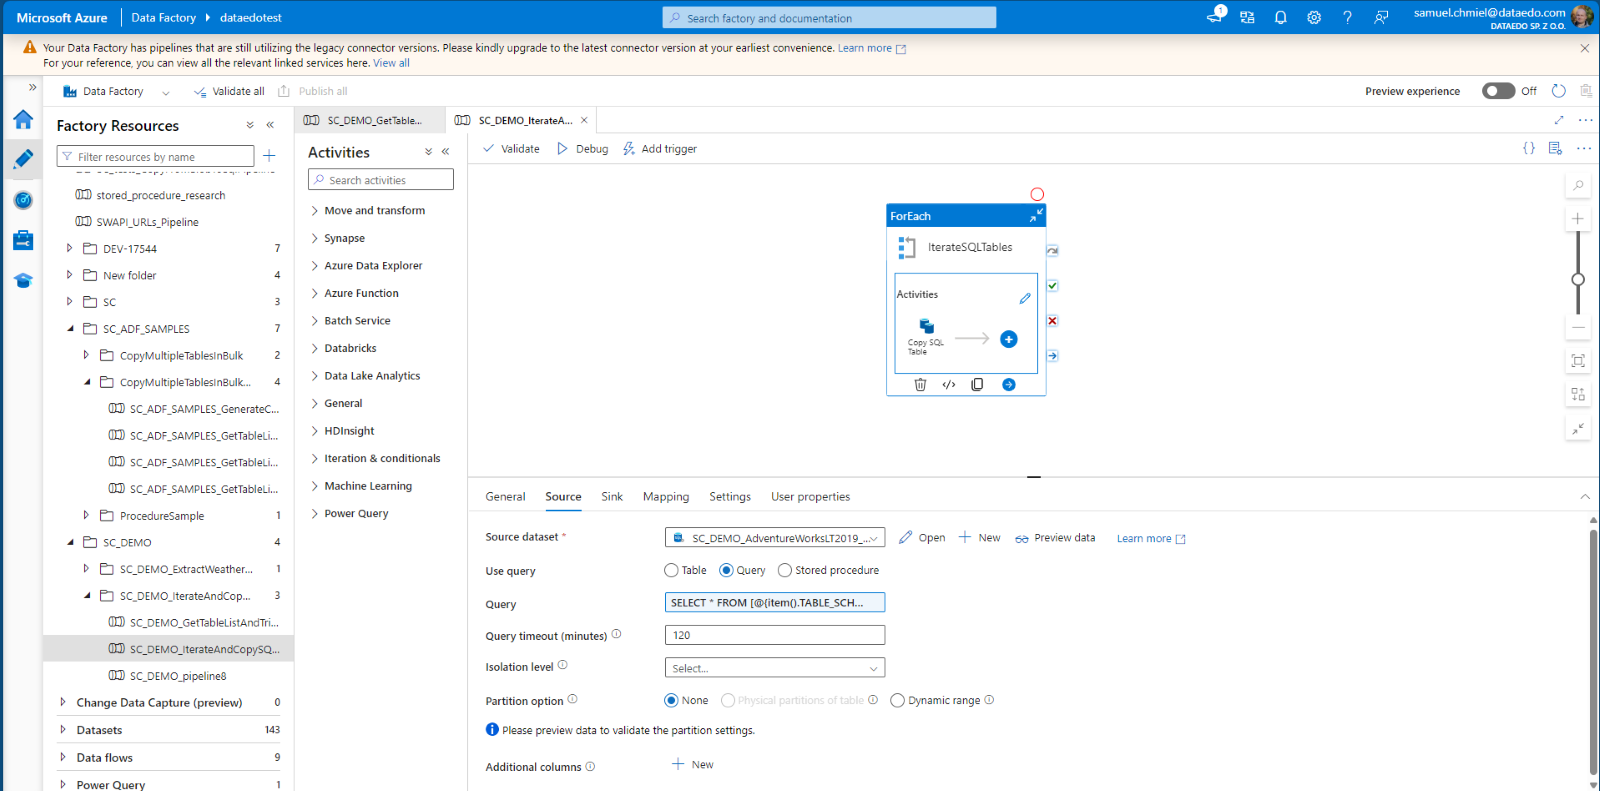
@concat('SELECT column_names FROM dbo.salesforce_column_names WHERE name = ''', pipeline().parameters.ObjectName, '''')@concat('Copy_', item().TargetTable)@concat('sales/', toLower(item().name), '/', utcNow('yyyy-MM-dd'), '/')SELECT * FROM [@{item().TABLE_SCHEMA}].[@{item().TABLE_NAME}]
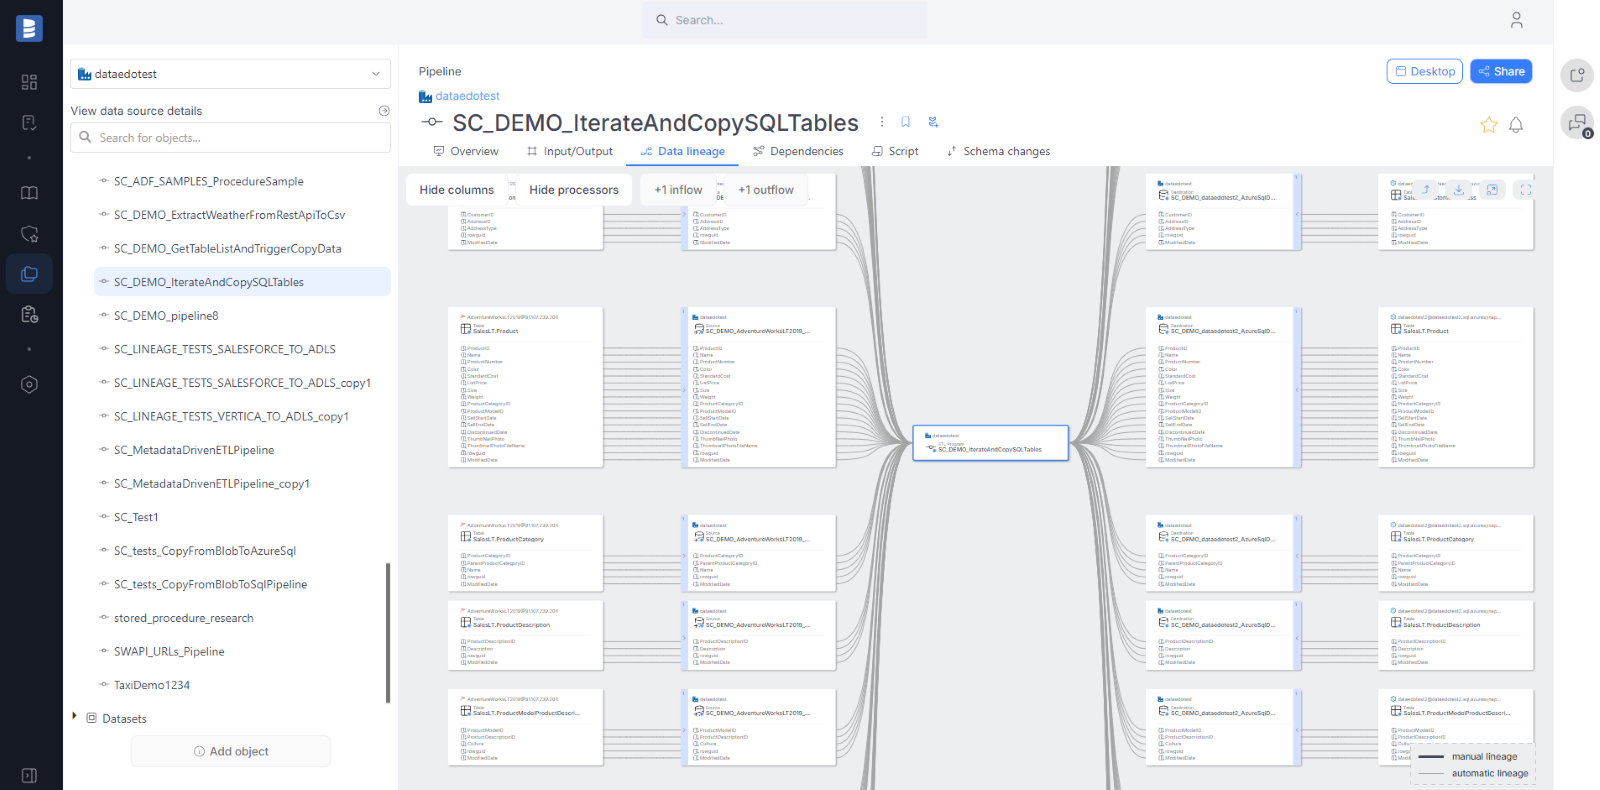
Now, in addition to automatic column-level data lineage from Tables in Copy Activity, we also support lineage from Queries and Stored Procedures.
Salesforce descriptions
Starting from version 24.4, Dataedo will import descriptions for Salesforce objects and fields.


SQL Parser and Data Lineage improvements
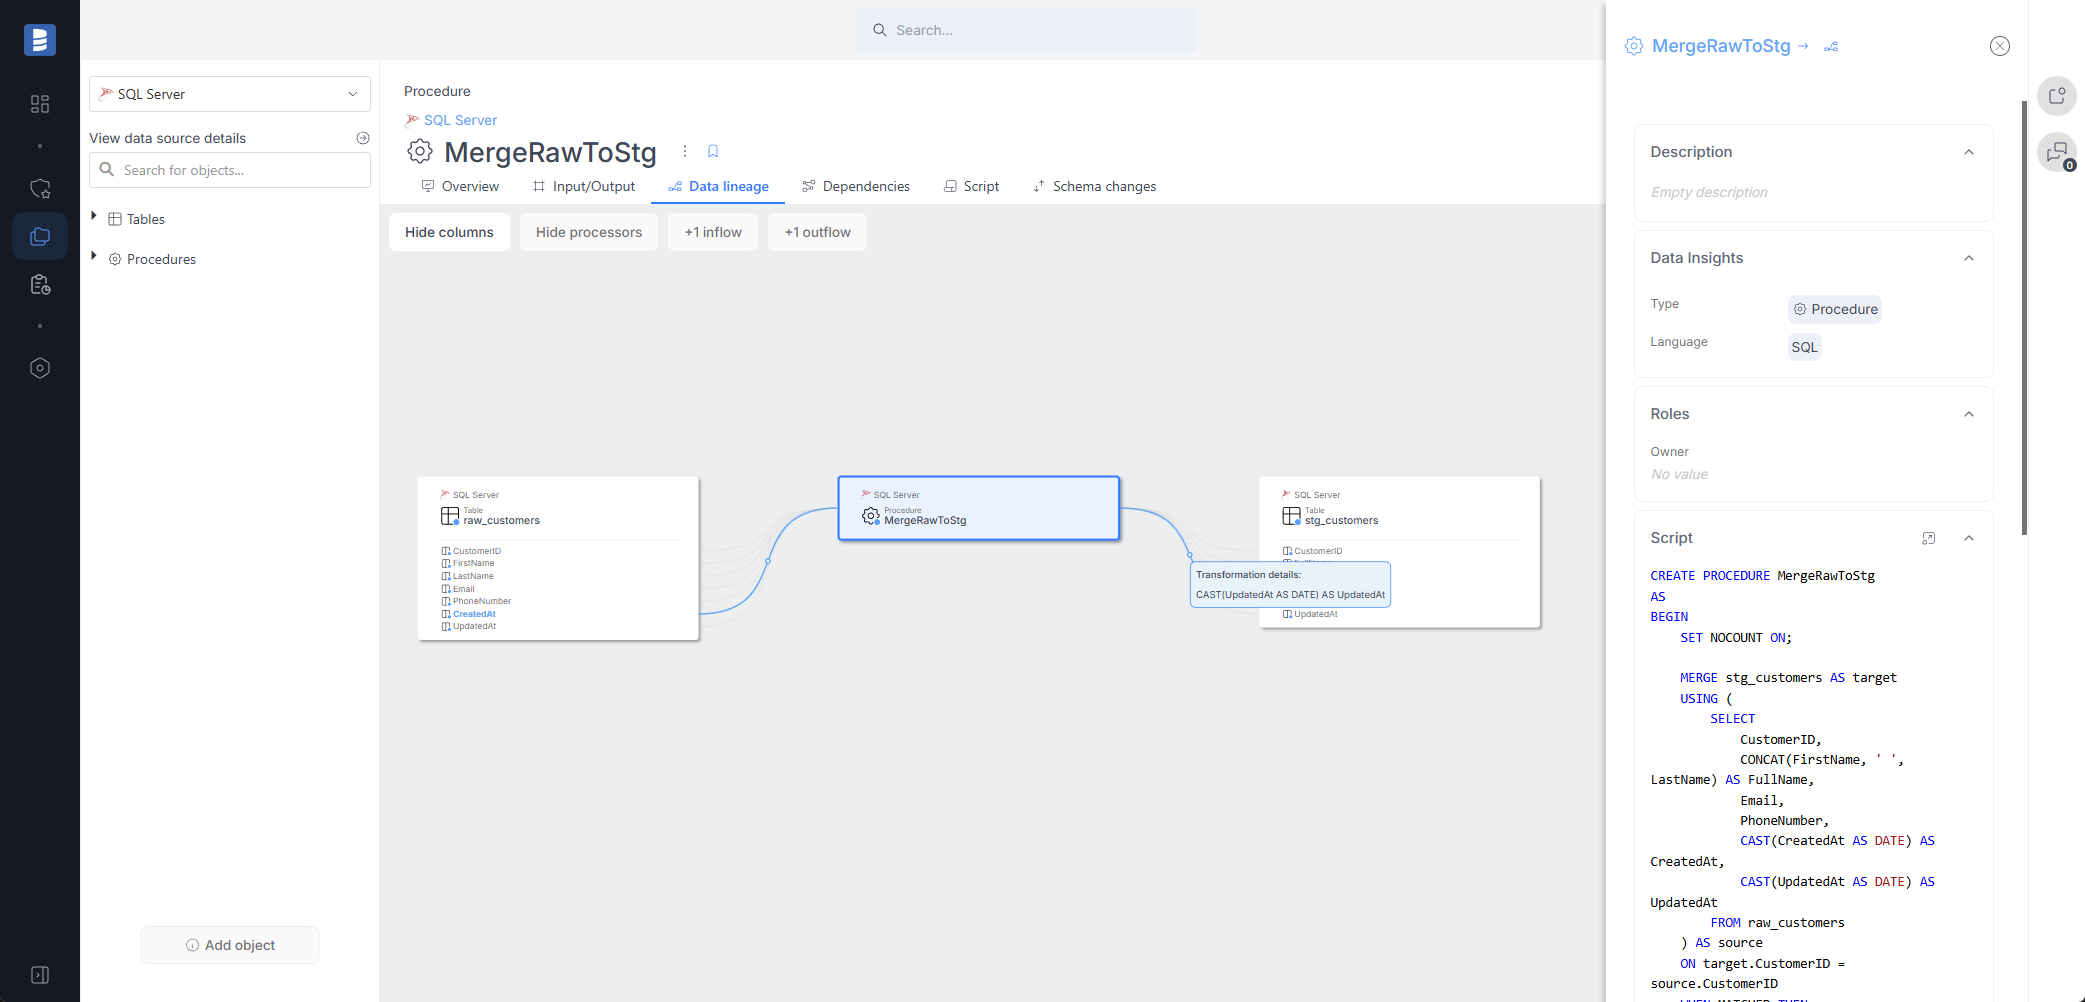
In version 24.4, we extended the Transact-SQL and PostgreSQL/PL/pgSQL parsers to support automatic column-level data lineage for MERGE statements.
Oracle (PL/SQL) procedures and functions parsing
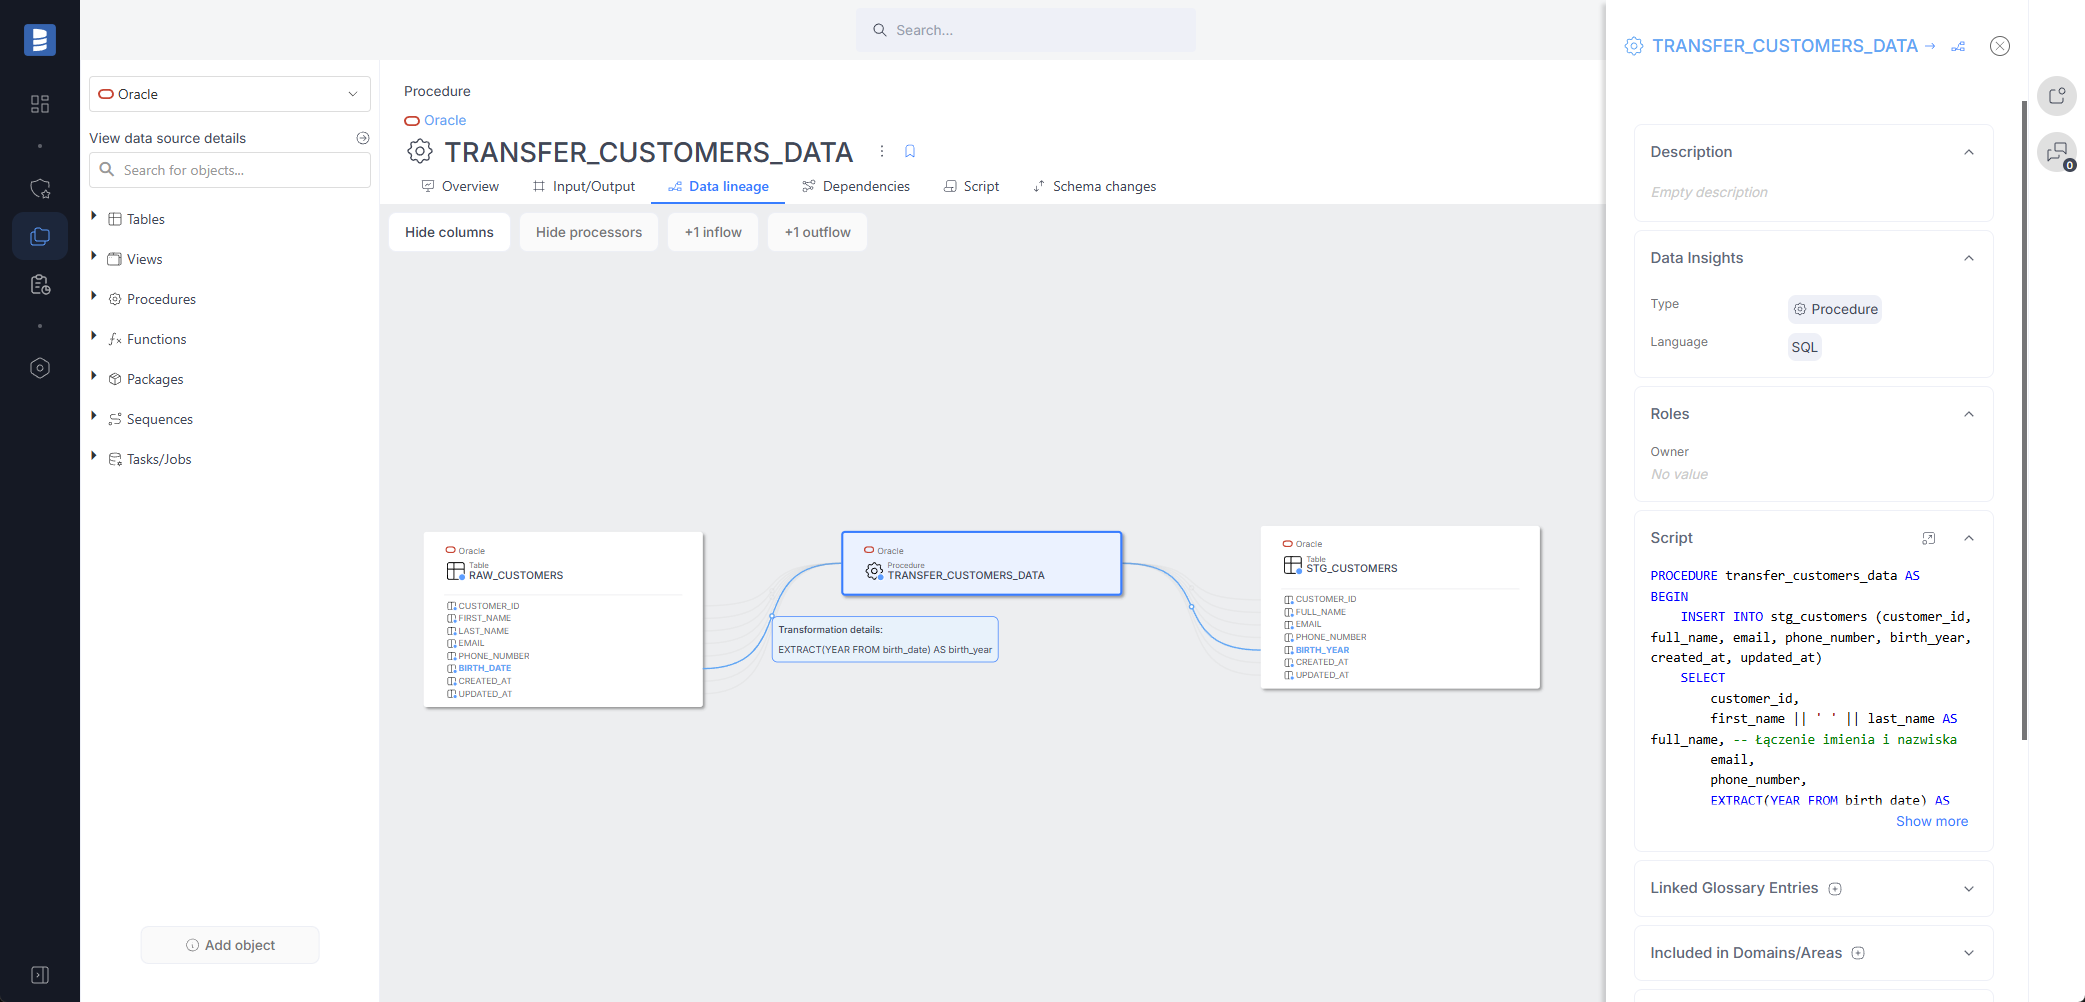
Dataedo now supports parsing Oracle PL/SQL procedures and functions. This means that during the import process, Dataedo will automatically build column-level data lineage based on procedure and function scripts.
Read more details here.
Import speed improvement
The import speed for every connector has been improved (synchronization stage). The speedup should be particularly noticeable in the connectors to Oracle and Oracle EBS.
More Public API endpoints
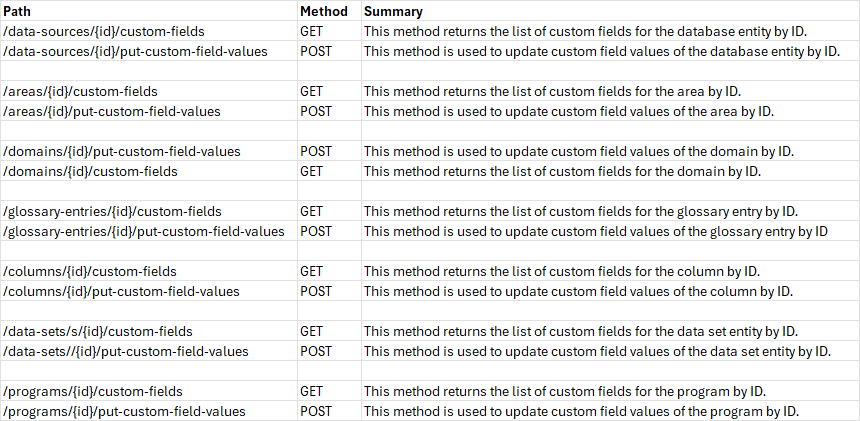
Based on user feedback, we've decided to add the following Public API endpoints:
UX/UI improvements in Portal
Navigation redesign
We’ve updated the navigation to better reflect the Portal’s features. Related topics are now grouped together, reducing the number of main navigation items and making it easier for users to find relevant information.
As we grouped some elements together, we also updated a few names and added labels to these groups. Below, you'll find a screenshot that shows the mapping between the old and new navigation. Most of the items are still there, but they may be in slightly different locations.
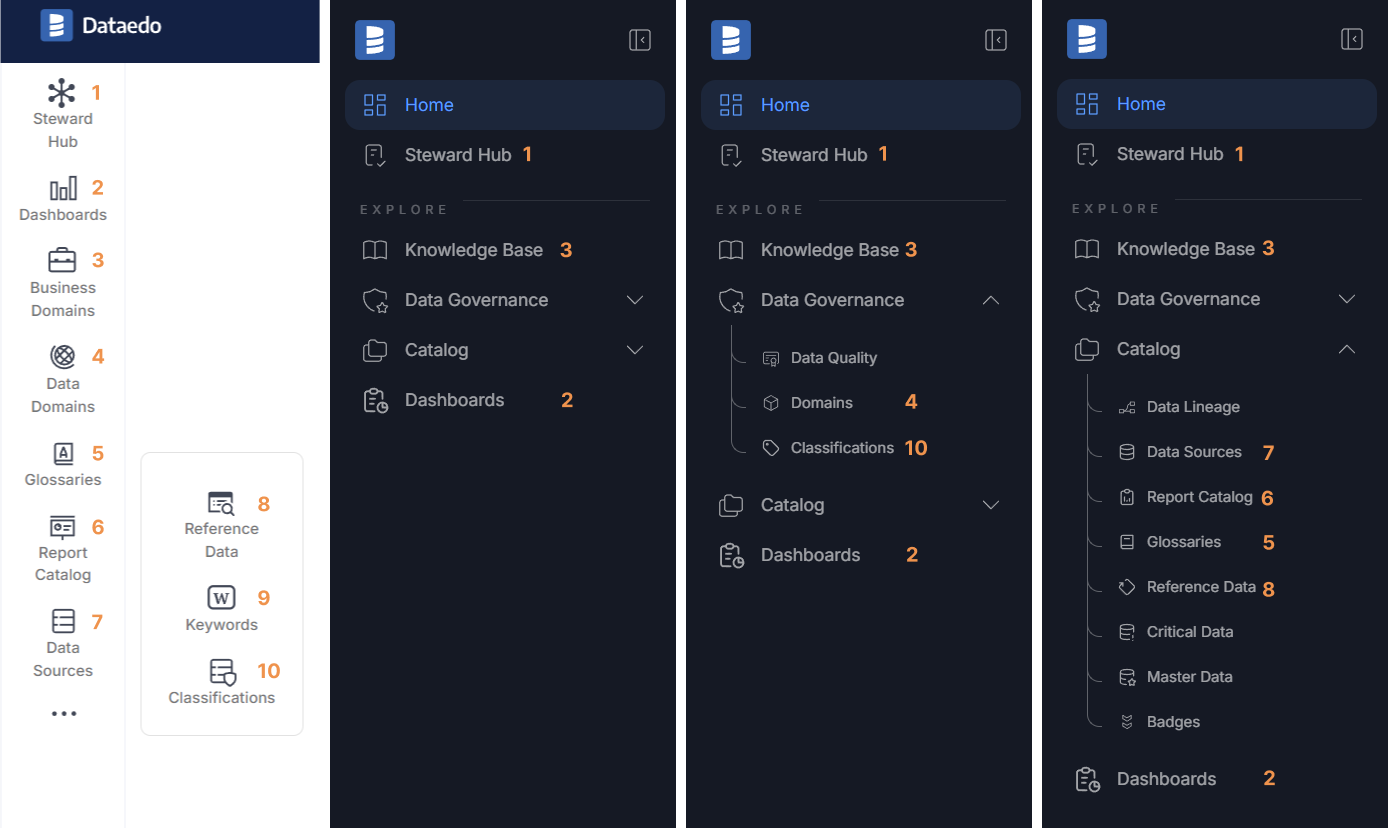
You can read more about the changes in our blog post here
New icon set
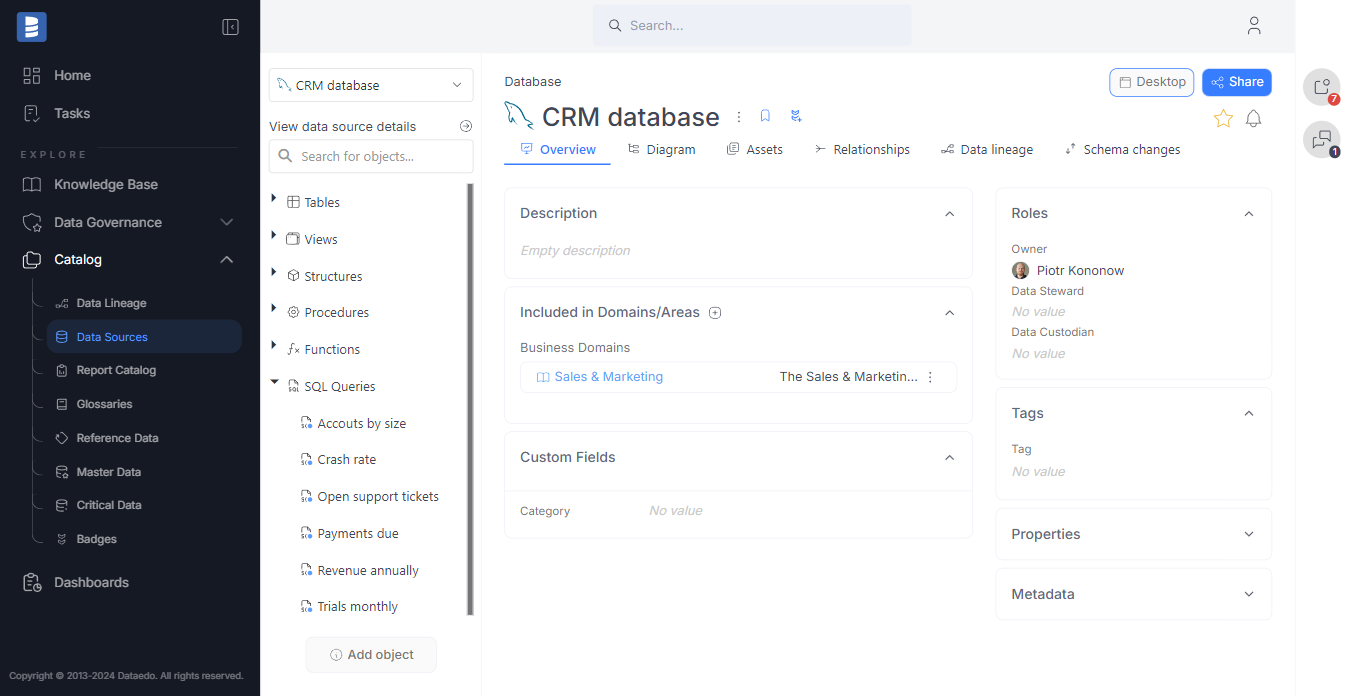
We have completely replaced our icon set to a new one. Additionally, we made some changes in how it was implemented and it should look better and more clear.
Keyword Explorer settings in Portal
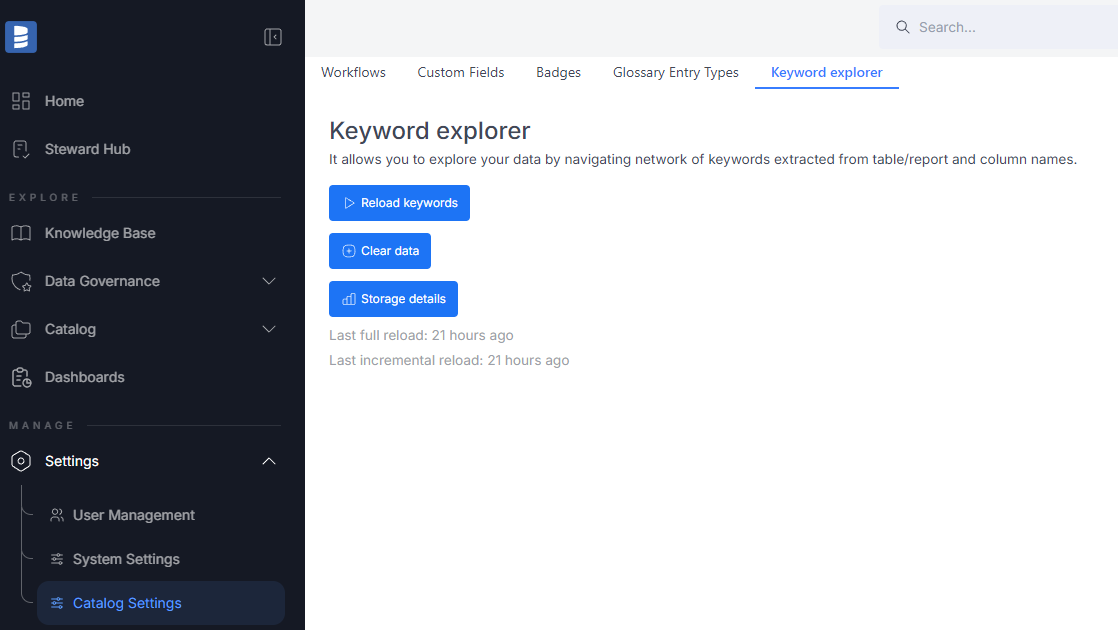
We’ve relocated the Keyword Explorer settings to the Catalog settings. All options and pages remain the same as before; nothing new has been added—it’s simply been moved.
