When building reports in Power BI, the magic doesn't happen in visuals - it happens in the data model. A well-designed model is the backbone of every reliable dashboard: it defines relationships, business logic, and performance. Yet, many teams jump straight into visuals before structuring their data properly. The result? Duplicated logic, inconsistent KPIs, and poor performance.
In this guide, we'll break down how data modeling in Power BI works, the key principles for designing robust relationships between data sources, and how you can take it further with Dataedo for documentation, consistency, and governance.
Why Data Modeling Matters in Power BI
Data modeling defines how different datasets connect and how Power BI understands relationships between them. Without a solid model, even the most beautiful visuals can deliver the wrong insights.
A good model enables:
- Single source of truth - one definition for every key metric.
- Performance and scalability - optimized joins, filters, and aggregations.
- Ease of maintenance - changes in one place, reused everywhere.
- Governed self-service - analysts can explore trusted datasets without breaking logic.
A solid Power BI model combines five core building blocks - from the raw tables that hold your data to the governance that keeps it consistent. Let's walk through each layer and see how they connect.
The Core Components of a Power BI Data Model
1. Tables and Sources
Every Power BI model starts with tables - the raw building blocks of your data model.
They can come from anywhere: a SQL Server database, Excel file, data warehouse, SharePoint list, or Power BI dataflow.
How you design, structure, and connect these tables determines the clarity, accuracy, and performance of everything built on top of them.
Poorly defined or duplicated sources lead to chaos: inconsistent numbers, broken joins, and models that are hard to maintain. Well-structured tables, on the other hand, create a solid foundation for relationships, measures, and governance.
Designing source tables
A good model begins with understanding what each table represents and how it contributes to your analysis.
1. Fact tables
Contain quantitative data - the events or transactions your business tracks.
Examples: Sales, Orders, Invoices, WebsiteVisits.
Best practices:
- Keep one record per transaction or event.
- Include only keys and metrics (e.g., Amount, Quantity, Cost).
- Avoid storing descriptive attributes here (those belong in dimensions).
2. Dimension tables
Provide descriptive context for facts - the "who," "what," "when," and "where."
Examples: Customer, Product, Date, Region.
Best practices:
- Use surrogate or numeric keys.
- Keep values unique per key.
- Include attributes used for grouping, filtering, or slicing (e.g., Category, Country, Segment).
3. Reference and lookup tables
Support additional mappings or categorizations, e.g., CurrencyRates, DiscountTypes, or StatusCodes.
These are often small but critical for data integrity and interpretation.
Organizing data before modeling
To ensure performance and maintainability:
- Remove unnecessary columns or tables.
- Ensure consistent naming and data types across sources.
- Use Power Query to clean and transform data before loading it into your model.
- Structure workspaces and dataflows by domain or business area (e.g., Sales, Finance, Operations).
- Document table purpose and refresh schedule - ideally in a data catalog.
The screenshot below shows a Power BI data model with clearly defined fact and dimension tables. The model follows a star schema, ensuring fast query performance and easy reporting.

How Dataedo helps structure and document sources
While Power BI focuses on modeling and visualization, Dataedo provides a centralized view of all your data sources and tables - helping you understand what's in your model before you even start building it.
On the screenshot below, you can see how Dataedo catalogs data sources connected to Power BI - including SQL Server databases, schemas, and tables. Each table includes metadata such as owner, description, column list, and relationships, making it easy to discover and standardize before importing into Power BI.

Why this matters
Your data model is only as good as the tables behind it. When your sources are structured, documented, and trusted, everything that follows - relationships, DAX, performance, and governance - becomes easier and more reliable.
Dataedo ensures that your Power BI models start with clarity and end with confidence.
2. Relationships
Relationships define how tables talk to each other. They're the bridge between your dimensions (e.g., Customer, Product, Date) and facts (e.g., Sales, Orders). They determine how data is filtered, aggregated, and combined across your model - so getting them right is critical for accuracy and performance.
On the first screenshot below, you can see a database relationship diagram from a SQL Server source, visualized in Dataedo_. It shows how fact and dimension tables are connected through primary and foreign keys - the foundation that Power BI later uses to establish model relationships. Documenting these connections in Dataedo helps ensure consistency, especially when multiple teams or data sources are involved.

Types of relationships in Power BI
When you define relationships in Power BI, you decide how tables connect and how filters flow between them.
There are three main types of relationships you'll typically work with:
-
One-to-many (1:*) - the most common setup. Each record in the "one" table (e.g., Customer) can relate to many records in the "many" table (e.g., Sales).
→ Example: Customer[CustomerID] → Sales[CustomerID] -
One-to-one (1:1) - both tables contain unique keys. Used when splitting a large table for performance or security reasons.
→ Example: Employee[ID] ↔ EmployeeDetails[ID] -
Many-to-many (:) - both sides have duplicate keys. Useful for bridge tables or mapping scenarios, but should be handled carefully to avoid ambiguity.
→ Example: Customers ↔ Regions via a linking table.
Each relationship also defines a cross-filter direction:
- Single direction (recommended for most models) filters data from dimensions to facts.
- Both directions can be used in advanced cases, but may cause circular dependencies or performance issues.
Creating relationships in Power BI
When building your model in Power BI:
- Identify matching columns (keys).
- Choose the right cardinality (1:1, 1:*, or :).
- Decide on the filter direction (single or both).
Example:
A one-to-many relationship between Customer[CustomerID] and Sales[CustomerID] ensures each sale connects to the correct customer record.
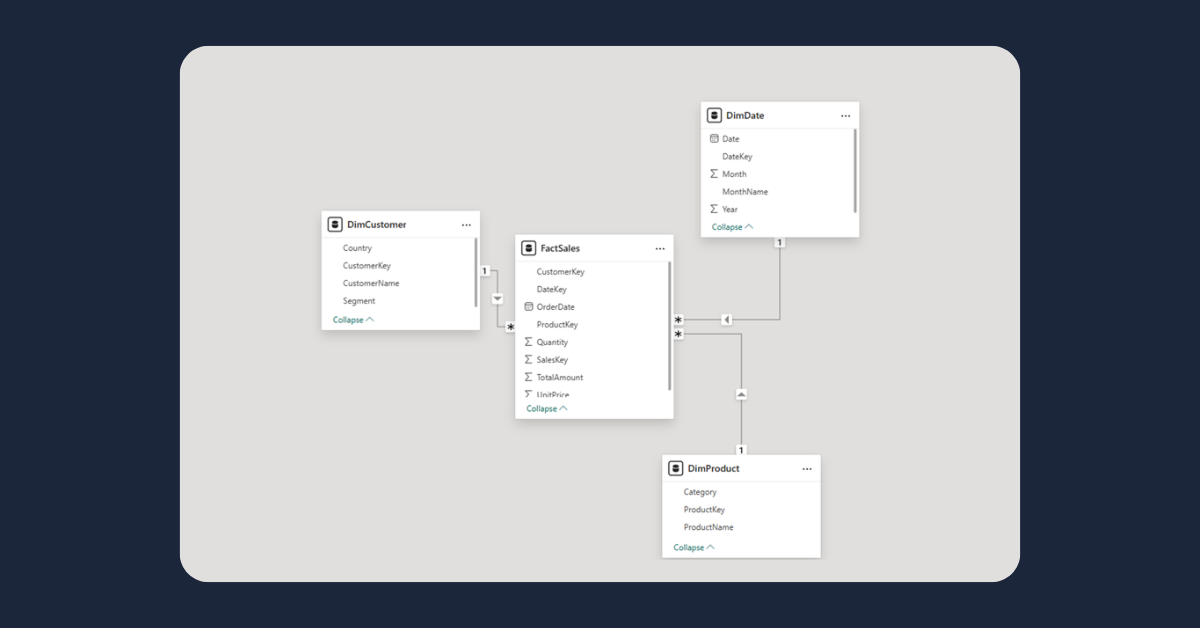
The screenshot below shows how these relationships appear in Power BI's Model View. Here, tables are linked visually to define how dimensions filter facts - creating the semantic model that powers your reports and DAX measures.

Best practices
- Use integer or GUID keys for relationships (avoid text keys).
- Keep filter direction single unless bidirectional is absolutely required.
- Avoid circular relationships and ambiguous joins.
- Test relationship integrity regularly with "Manage Relationships" and "Data View."
- Document your relationships in Dataedo - it helps track lineage and dependencies across models and databases.
3. Calculated Columns and Measures
Once relationships are in place, the next step in building a Power BI data model is defining business logic using DAX (Data Analysis Expressions). DAX formulas turn raw data into insights - they calculate revenue, margins, conversion rates, and any KPI your organization tracks. This layer transforms technical data into meaningful business language.
Calculated Columns vs. Measures - what's the difference?
Although both use DAX, they serve distinct purposes in your model. Understanding when to use each is essential for accuracy and performance.
Calculated Columns
Calculated columns are created at the row level.
They extend your data by adding new fields stored within your model - each row gets its own calculated value.
Example:
Profit = Sales[Amount] - Sales[Cost]
Use when:
- You need a field for filtering, grouping, or joining.
- The logic must exist for every record (e.g., flag, category, or segment).
Be cautious:
Calculated columns increase model size and refresh time - avoid them when an aggregated measure can achieve the same goal.
Measures
Measures compute aggregated results dynamically, depending on filters and context in your report.
They don't store data - they calculate values on demand.
Example:
Total Sales = SUM(Sales[Amount])
Profit Margin = DIVIDE([Total Profit], [Total Sales])
Use when:
- The metric depends on user filters or visuals.
- You need performance-efficient, reusable KPIs.
Measures are the foundation of Power BI analytics - they define your organization's business metrics in a consistent, reusable way.
Organizing and documenting DAX logic
As your model grows, documenting DAX becomes essential. Even simple formulas can become black boxes for other teams.
Best practices:
- Group measures into folders (e.g., Finance KPIs, Customer Metrics).
- Apply consistent naming conventions (e.g., Total Sales, Active Customers, Avg Order Value).
- Write short, clear descriptions explaining what each measure means and how it's calculated.
- Keep business intent together with technical formulas.
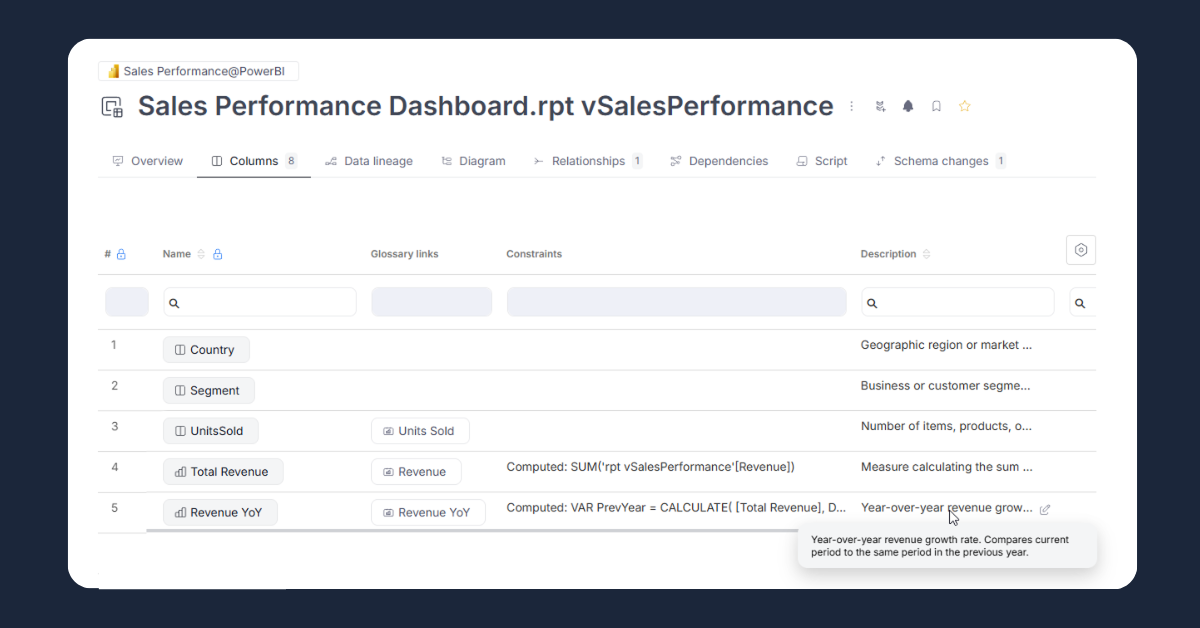
The screenshot below shows a DAX measure created in Power BI's Data View. Here, you can see how business metrics like Total Revenue or Profit Margin are defined and grouped for reuse across reports.

From column to measure: lineage in Dataedo
Power BI models often combine multiple transformations - dataflows, datasets, calculated columns, and measures.
Tracking where a measure's logic originates can be difficult, especially when it depends on multiple tables or sources.
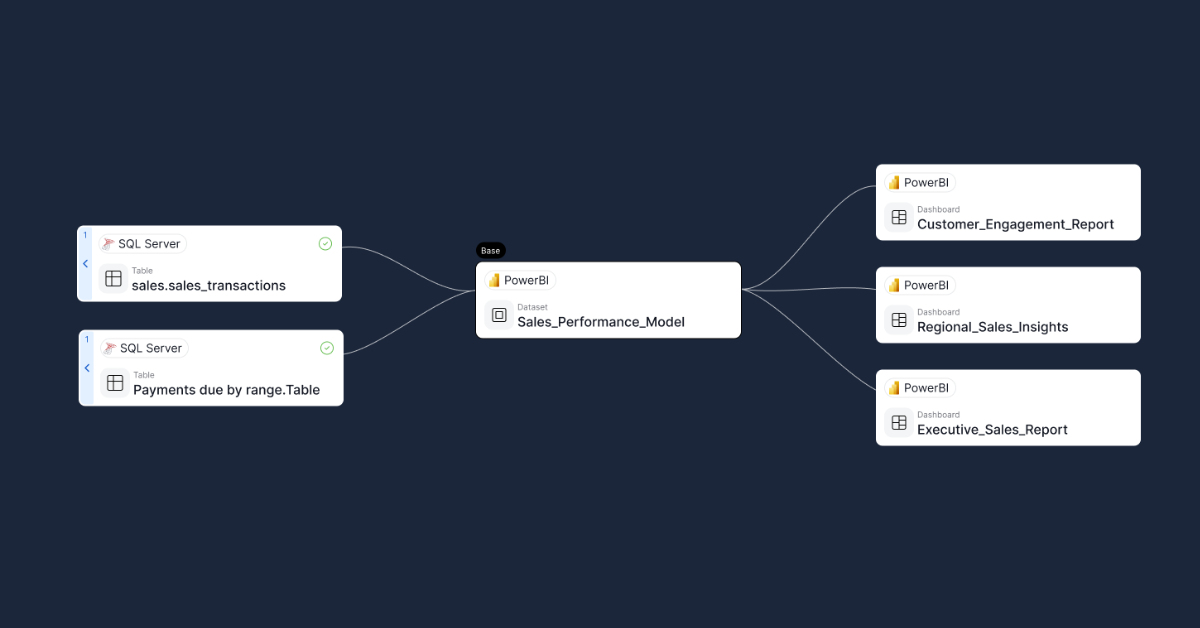
That's where Dataedo's lineage view makes a real difference.
On the screenshot below, you can see how Dataedo visualizes end-to-end lineage from a source column (e.g., Sales[Amount] in SQL Server) through dataflows and datasets, all the way to the DAX measure that uses it in Power BI. This gives you full visibility of how data moves, transforms, and feeds into business metrics.

Benefits:
- Understand which fields and tables feed each measure.
- Run impact analysis before modifying or renaming a column.
- Quickly troubleshoot broken calculations.
- Ensure transparency and auditability across models and teams.
Why Dataedo adds value
While Power BI focuses on building and visualizing measures, Dataedo connects them to their roots - showing exactly how each KPI is derived from source data. It bridges the gap between technical lineage and business meaning:
- Centralized measure catalog with DAX logic and descriptions.
- Visual column-to-measure lineage for clarity and control.
- Linked business glossary explaining each KPI in business terms.
Together, Power BI and Dataedo ensure your calculations are not just powerful - they're trusted, documented, and traceable.
4. Model Performance and Optimization
A well-designed Power BI model doesn't just deliver accurate insights - it also needs to perform efficiently.
As data volume and complexity grow, poor design can lead to slow visuals, long refresh times, and overloaded capacities.
Optimizing your data model ensures smooth user experience, faster queries, and scalable analytics.
Common performance challenges
Even well-built models can slow down if key optimization principles are ignored. Typical issues include:
- Too many calculated columns inflating model size.
- High-cardinality columns (many unique values) reducing compression.
- Excessive bi-directional relationships creating circular filter paths.
- Inefficient DAX measures performing heavy row-by-row calculations.
- Unoptimized refreshes or large fact tables with no aggregations.
Each of these can degrade report performance, especially when multiple users query shared datasets.
Power BI optimization techniques
Here are proven techniques to improve model speed and efficiency:
1. Use star schemas
Organize your data into a star schema - one fact table connected to multiple dimension tables. This structure simplifies relationships, improves query performance, and keeps filtering predictable.
2. Limit model size
- Remove unused columns and tables.
- Use numeric keys instead of text.
- Avoid calculated columns when a Power Query transformation can do the same.
3. Optimize DAX
- Use measures instead of calculated columns where possible.
- Replace FILTER() with more efficient functions like CALCULATE() when applicable.
- Avoid row-by-row iterators (SUMX, FILTER) on large tables unless necessary.
4. Manage refreshes efficiently
- Configure incremental refresh for large datasets.
- Schedule refreshes during off-peak hours.
- Monitor refresh durations and failures using Power BI Service metrics.
5. Monitor and analyze performance
Use built-in Power BI tools to identify bottlenecks:
- Performance Analyzer - see how long visuals and queries take.
- DAX Studio - check query plans and memory usage.
- VertiPaq Analyzer - examine table compression and model size.
The screenshot below shows Power BI's Performance Analyzer in action. It breaks down the time spent on DAX queries, visuals, and data refreshes - helping you identify the most demanding components in your report.

How Dataedo supports performance optimization
While Power BI helps you measure performance at runtime, Dataedo helps you understand what's behind it - the structure and dependencies that affect performance.
On the screenshot below, you can see a lineage in Dataedo. It shows how source tables, columns, and transformations connect to Power BI datasets, measures, and reports. This visibility helps you identify redundant data flows, unused objects, and overly complex dependencies that can slow down refreshes and queries.

Why Dataedo matters for performance
Power BI shows what is slow - Dataedo helps explain why. By documenting your data model and mapping full lineage, you can:
- Identify unused or redundant data sources increasing model load.
- Detect complex dependencies that slow down refresh cycles.
- Ensure consistent and efficient model structure across teams.
Together, Power BI and Dataedo give you both perspectives - runtime metrics and structural insights - enabling faster, more reliable BI at scale.
5. Documentation and Governance
A Power BI model isn't just about data - it's about trust. No matter how well you design your relationships, DAX, and performance, your analytics will only scale if everyone understands what the data means, where it comes from, and who owns it. That's where documentation and governance come in - turning technical models into shared, governed business assets.
Why documentation matters
Power BI makes it easy to build models, but without documentation, every team ends up reinventing the wheel:
- Analysts rebuild the same measures.
- Teams argue over which version of "Revenue" is correct.
- No one knows who owns a dataset or how it's refreshed.
Good documentation connects people, process, and data. It ensures that technical logic aligns with business meaning - and that models can be reused safely across the organization.
What to document in Power BI models
Your goal is to make each dataset self-explanatory and auditable. Here's what every well-documented Power BI model should include:
1. Dataset-level information
- Purpose and scope - what the model covers.
- Owner and steward - who's responsible for maintenance and approvals.
- Refresh schedule - how often the data updates and from where.
- Security model - which RLS/OLS roles apply.
2. Table and column details
- Table descriptions (what it represents, e.g., Customer, Sales Transactions).
- Column explanations, formats, and classifications (e.g., PII, Currency).
- Tags or domains for easier search and reuse.
3. Measures and calculations
- DAX formula with readable logic.
- Business definition ("Revenue = Total amount from paid orders").
- Links to related glossary terms (Revenue, EBITDA, Customer Count).
4. Relationships and lineage
- Which tables connect and how.
- Upstream and downstream dependencies (dataflows, SQL tables, reports).
- Visual lineage diagrams for impact analysis.
How Dataedo extends documentation and governance
Power BI offers great modeling features - but governance doesn't stop at the desktop.
Dataedo adds the missing layer of enterprise visibility, documentation, and accountability.
On the screenshot below, you can see a Power BI dataset fully documented in Dataedo - including description, owners, table and column details, and DAX measures linked to glossary terms, Power Query script.


How Dataedo Adds Value to Power BI Data Modeling
Power BI provides great modeling tools - but it stops short of full governance. Once models multiply across teams, questions arise:
Who owns this dataset? What does this measure mean? What breaks if we rename this column?
That's where Dataedo comes in.
1) Central Data Catalog
Connect Power BI datasets, semantic models, and source systems in a single catalog. Browse tables, measures, and columns with clear definitions and business context.
2) Business Glossary
Define terms like Revenue, Churn, or Active Customer and link them directly to your DAX measures and model fields - ensuring consistent meaning across reports.
3) End-to-End Lineage
Visualize lineage from source systems → dataflows → datasets → reports. See exactly how your Power BI model connects to underlying data - perfect for impact analysis and audits.
4) Ownership and Documentation
Assign owners and stewards, track refresh schedules, and describe datasets and measures. Make your Power BI models understandable for both developers and business users.
5) Governed Self-Service
Empower analysts to reuse certified datasets and measures instead of rebuilding logic - accelerating delivery while keeping control.
Key Takeaway
Strong data modeling is the foundation of every Power BI solution. But scaling it across teams requires visibility, documentation, and trust.
With Dataedo, you can go beyond relationships and DAX - turning your Power BI models into governed, discoverable, and auditable data assets.
Build a Trusted Power BI Model with Dataedo
Document your Power BI datasets and DAX, align everyone on shared definitions, and map end-to-end lineage - all in one place.
Book a short demo or start a free trial today to turn your data models into trusted insights.