Power BI has become the go-to analytics tool for organizations of all sizes - from agile startups to global enterprises. Its flexibility allows teams to quickly build reports, visualize KPIs, and share insights. But as Power BI adoption grows, so does the complexity: dozens of datasets, hundreds of reports, and thousands of DAX measures - all living across multiple workspaces.
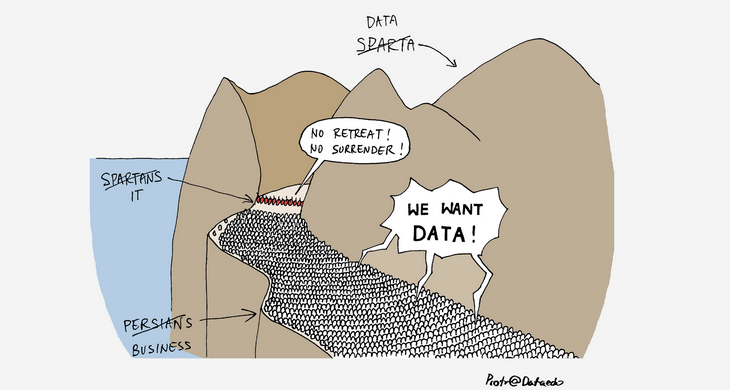
Sooner or later, teams face the same challenge:
"Who owns this report? What does this measure calculate? Where does this data come from?"
That's where a Power BI documentation tool like Dataedo comes in.
Dataedo connects directly to Power BI to extract metadata, build lineage, and enrich documentation with business context - all in one place. It turns Power BI from a black box into a transparent, governed, and trusted data ecosystem.
Below are eight ways (plus a bonus) Dataedo transforms Power BI documentation from a manual chore into an automated, structured process that scales.
1. Catalog Power BI Assets
The first step toward Power BI governance is visibility. Dataedo automatically scans and catalogs your Power BI environment - identifying and documenting:
- Reports and dashboards,
- Datasets, dataflows
- Informations about datasources
Each asset is stored in a central metadata repository enriched with ownership, descriptions, tags, and linked business context. You can easily browse, search, and filter Power BI objects by type, workspace, or data domain - creating a single, governed view of your BI landscape.
Example: Need to find all reports built on the Sales Dataset or connected to the Finance Domain? One search in Dataedo shows you every dependent dataset, table, and report owner.
Benefits:
- Complete inventory of Power BI assets in one place.
- End-to-end visibility across datasets, reports, and dataflows.
- Faster onboarding for new BI users and analysts.
- Consistent foundation for governance and documentation initiatives.

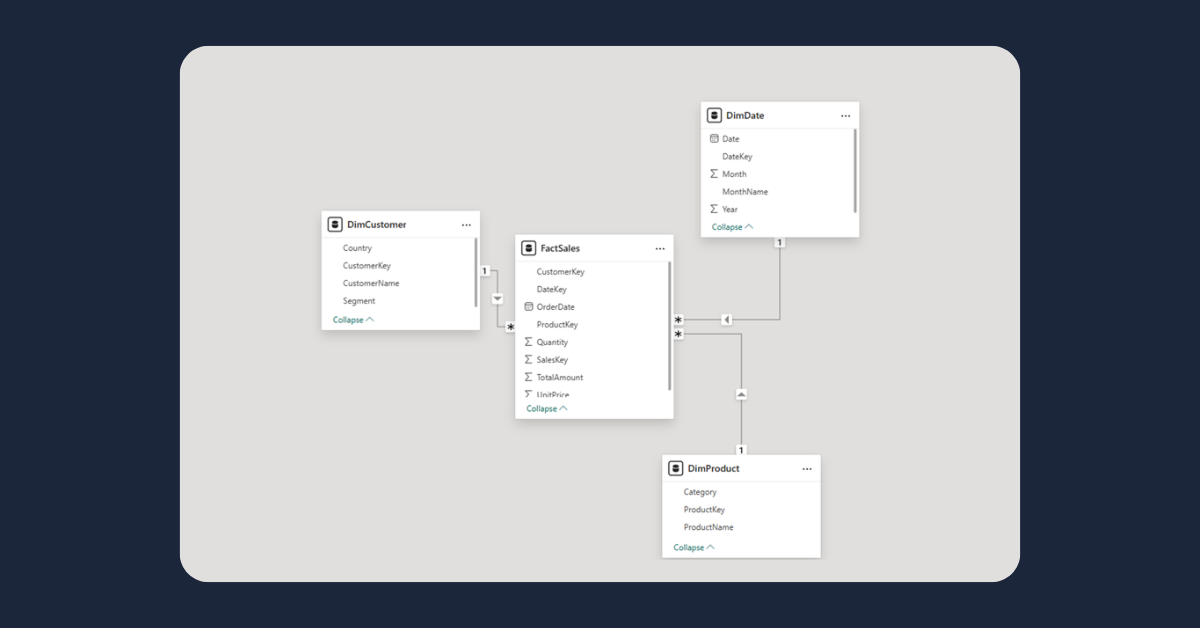
2. Document Datasets, Tables, and Columns
Power BI models are powerful - but without documentation, they quickly turn opaque. With Dataedo, you can document each dataset, table, and column with human-readable descriptions, business context, and technical details.
Examples:
- Table: SalesTransactions → "Contains all finalized sales by region and channel. Updated nightly from ERP."
- Column: Amount → "Net sales value after discounts and returns. Used in Total Revenue measure."
You can also tag sensitive or critical data fields, define data domains.
Benefits:
- Self-explanatory models for analysts and report consumers.
- Clear documentation for audit, compliance, and lineage tracking.
- Better collaboration between BI developers and business teams.

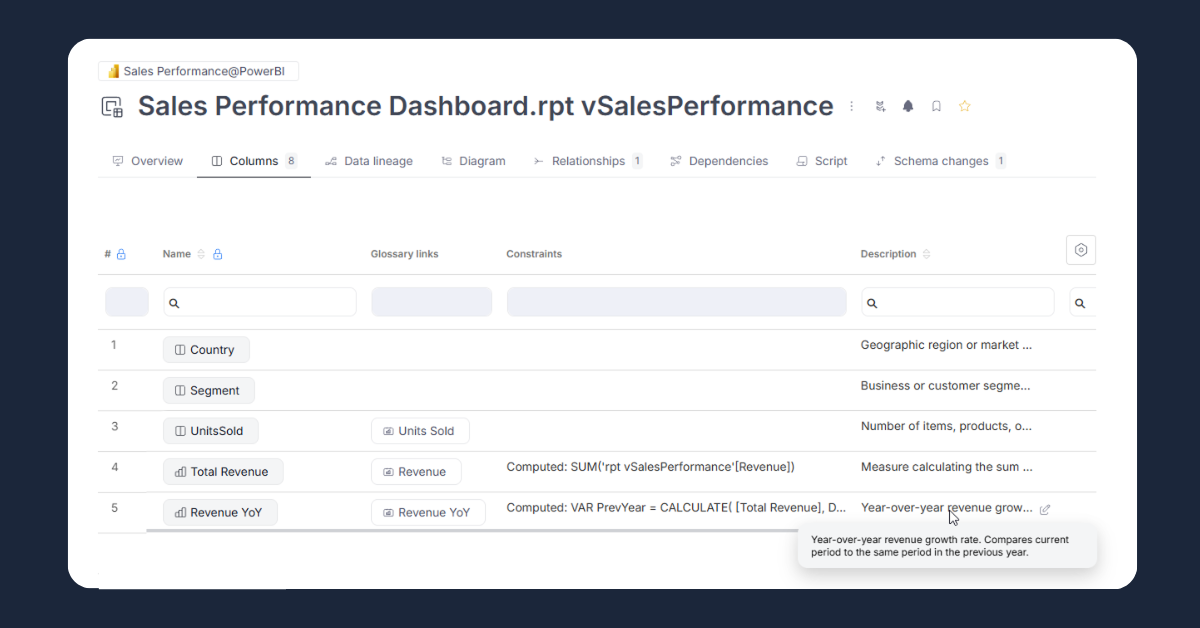
3. Capture and Document DAX Logic
Power BI's true power lies in its DAX formulas - but without documentation, they're a black box. Dataedo extracts all DAX measures and calculated columns from your datasets, allowing you to describe their business purpose, calculation logic, and dependencies.
Examples:
- [Total Revenue] = SUM(Sales[Amount])
- [Profit Margin] = DIVIDE([Total Profit], [Total Revenue])
You can group measures into thematic folders (Finance KPIs, Customer Metrics, Marketing Performance), link them to glossary terms, and maintain consistent definitions across reports.
Benefits:
- Consistent metric definitions across teams.
- Easier debugging and formula review.
- Documentation that connects technical formulas with business meaning.

4. Visualize End-to-End Lineage
Dataedo gives you full visibility into how data moves through your analytics ecosystem - both at the system level and the column level.
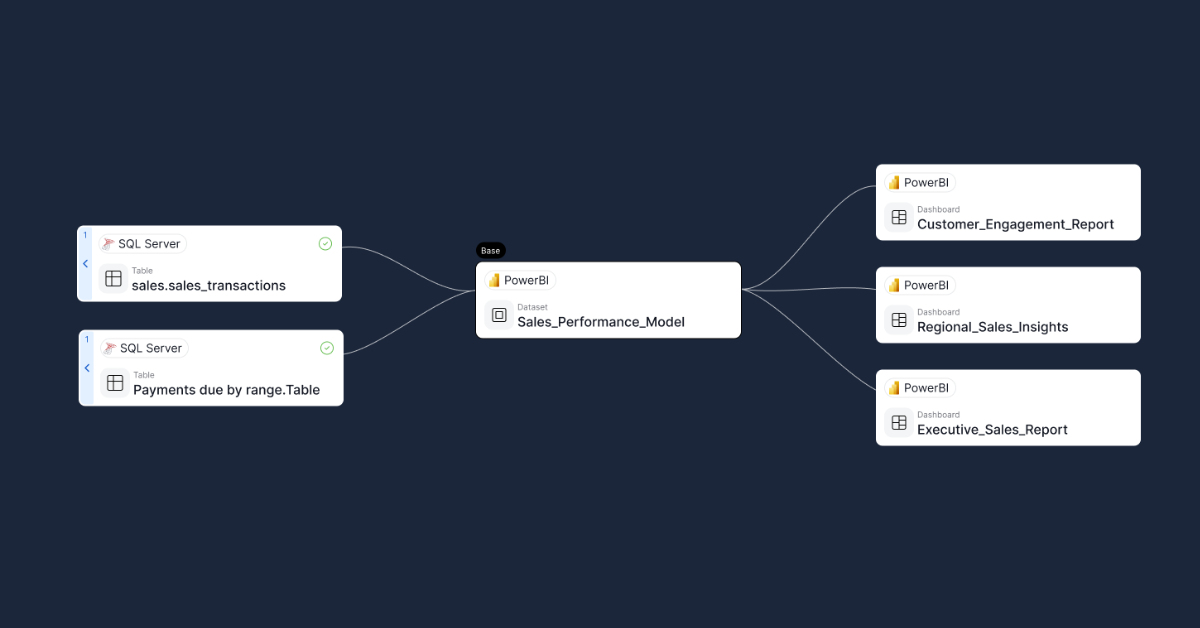
4.1 System-Level Lineage
The system-level lineage diagram shows how information flows across platforms:
from ETL processes → databases or data warehouses → Power BI datasets → reports.
This "big picture" view is invaluable for data engineers, architects, and governance teams who need to understand dependencies across systems.
Example:
CRM / ERP Systems → ETL (Data Factory, SSIS) → Data Warehouse (SQL Server / Snowflake) → Power BI Dataset → Reports
Benefits:
- Clear visualization of system interconnections.
- Easier communication across data and BI teams.
- Simplified root cause analysis when upstream data changes.
- High-level governance visibility for architecture reviews.

4.2 Column-Level Lineage
For detailed analysis, Dataedo maps how data flows between columns and measures. You can see how a field in Oracle or SQL Server is loaded into Power BI, and finally displayed in a report visual.
Benefits:
- Transparent transformation chains.
- Reliable impact analysis before schema or measure changes.
- Assurance that Power BI reports reflect accurate, validated data.
Together, these two views make lineage both high-level and actionable - a rare combination in BI documentation.

5. Build a Business Glossary
Every organization has its own language - terms like Revenue, Active Customer, or Churn Rate appear everywhere, but often mean different things to different teams.
With Dataedo, you can create a centralized business glossary and link each term directly to datasets, columns, or DAX measures in Power BI.
Example:
- Term: Net Revenue → linked to [Total Sales] - [Discounts] measure.
- Term: Active Customer → linked to [CustomerCount_Active].
Benefits:
- Unified business language across reports and dashboards.
- Reduced confusion and metric disputes.
- Simplified training and onboarding for analysts.

6. Add Governance, Ownership & Quality Context
Documentation without governance is only half the picture. Dataedo enables you to define ownership, stewardship, and certification for every dataset, report, and dashboard.
You can assign roles like Data Owner, Steward, or Domain Lead, and capture metadata such as:
- Refresh frequency,
- Access control and sensitivity,
- Data domain and certification status (Promoted/Certified).
Example: The Finance Dataset is owned by John Smith, stewarded by BI Team West Europe, refreshed daily at 3 AM, and classified as Certified.
Benefits:
- Clear accountability for all Power BI assets.
- Improved audit readiness and regulatory compliance.
- Stronger collaboration between business and IT.

7. Data Quality at the Source
Power BI is only as reliable as the data it's built on. Even the most beautiful dashboards lose trust if the underlying data is incomplete, inconsistent, or outdated.
Dataedo helps you not only document data quality rules but also execute them directly on your source systems - giving you measurable, up-to-date insights into the actual quality of your data before it ever reaches Power BI.
You can define and run checks that evaluate:
- Completeness (missing or null values),
- Accuracy (invalid or out-of-range data),
- Uniqueness (duplicates and key violations),
- Timeliness (stale or delayed data loads).
Each rule can be linked to a specific table or column, and the results are stored in your catalog - allowing you to monitor data health over time.
Examples:
- Run a data quality check to identify customers without assigned regions.
- Detect null or duplicate values in key columns.
- Add notes about transformation filters or data corrections.
Benefits:
- Power BI reports built on validated, trustworthy data.
- Transparent overview of data health across systems.
- Early detection of data issues before they affect dashboards.
- Stronger collaboration between data engineers and BI developers.

8. Reports Usage
Dataedo also imports Power BI report usage metrics, giving you visibility into which reports are actively used - and which ones are outdated or redundant.
By analyzing usage information, you can:
- Identify popular reports across your organization.
- Detect unused or duplicate reports to clean up your environment.
- Prioritize maintenance and governance efforts based on actual adoption.
This insight helps BI teams focus on what matters - maintaining and improving reports that drive real business value, while safely archiving unused content.
Benefits:
- Optimized Power BI environment with fewer redundant assets.
- Data-driven governance and content lifecycle management.
- Better understanding of user adoption and reporting demand.

Make Your Power BI Environment Transparent with Dataedo
Power BI helps you build insights - **Dataedo helps you trust them.**By combining automated metadata extraction, lineage, glossary, governance, and usage analytics, Dataedo turns Power BI into a discoverable, auditable, and collaborative ecosystem.
Whether you manage a single workspace or an enterprise BI platform, Dataedo gives you:
- Full visibility of your Power BI landscape.
- Business context around every dataset and KPI.
- Clear ownership and governance.
- Reliable data lineage from source to dashboard.
Book a short demo or start a free trial to see how Dataedo can document your Power BI reports, datasets, and dashboards - and bring clarity, trust, and governance to your analytics ecosystem.