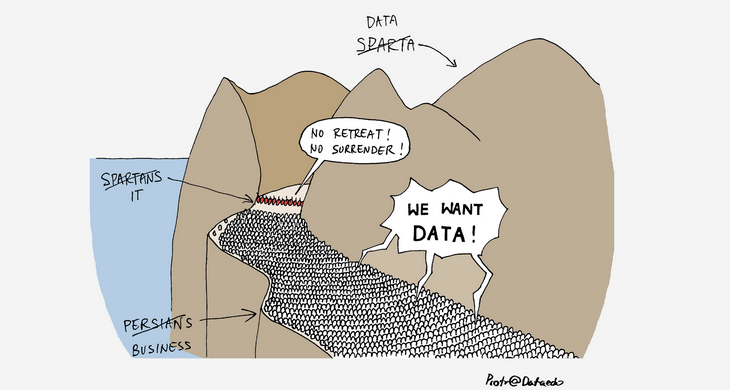
For many years I was a BI/data warehouse consultant and architect and had a chance to work for many different industries. Back then I had no idea what a business glossary was but soon understood that having a common understanding of basic business concepts by IT and all business units is one of the key deliverables any analytics or BI project should start with. I saw firsthand how lack of such understanding of even very basic concepts led to unnecessary iterations, wasted time of many business people, delayed projects for months and bloated man-days made many BI projects go under water.
We learned the hard way that having a common language and universal definitions was a key to success in analytics and BI. In this article I will share my experience from different industries.
Utilities (gas provider)
Many years ago I worked for a gas company to help them build data mart for gas distribution and balance. One of their key metrics was a number of active, new and leaving customers. I quickly learned that people in different departments and in different contexts understood and calculated those metrics very differently. Those were the variations of the number of customers:
- Number of unique people/businesses on agreements - if an existing customer buys a new house and connects a gas then is not counted as new,
- Number of agreements (contracts) - this one usually works, as each house/address usually has a separate agreement but customers have bundled agreements for all their properties,
- Number of unique addresses - this one counts unique addresses, but if addresses lacked apartment numbers, then all apartments in the block or houses occupied by multiple families were counted as one, which was incorrect,
- Number of installations - this method counts each single logical gas “installation”, quite a good method,
- Number of gas meters - that is not ideal too, because some installations had more than one gas meter
Each of these techniques gave slightly different results and none were perfect. Differences weren’t significant enough to spot them easily but big enough to require explanation, even to regulators, as the energy industry is heavily regulated in Europe.
Solution? Introducing different name for each metric and sharing this throughout the organization and with the regulator. In a perfect world, regulator (or even EU) will define those metrics with a method of calculation so there would be an industry-wide glossary.
Telecommunications
A few years ago I took part in a quite big project of reporting on the network infrastructure for large telecommunications company. It was really complicated stuff, as network infrastructure has plenty of entities - physical and virtual, much more abstract than what I saw in other industries.
I was a part of the analysts’ team trying to gather and specify requirements for some 300 reports. Many of which were for the regulator. We had to talk to many people in the regulatory reporting department, each specializing in a different area of the company infrastructure, to get reported metrics and their definitions. What struck me is that each person understood many of them differently. One such metric was a number of ports.
Ports are both physical and logical entry points in various (again, physical and logical) devices that you connect a network “service” to. I remember hours-long discussions about what a number of ports meant and how it should be calculated for a specific report or department. I remember there was often no consensus. The project was taking over a year and we still didn’t have a clear definition of the reports. In the end it was canceled and the reports were not delivered.
Solution? Identify different uses and calculation methods for a number of ports, create unique names for those metrics, write everything down in a business glossary and share across the company and the regulator.
Asset/investment management
For the last couple of years I worked for wealth & asset management industry in the UK. One of the key metrics in the industry is Assets Under Management (AUM) - it represents how much client money and assets (at current valuation) is under company management.
It sounds straightforward but it isn’t that simple. The difficulty lies in the “managed” part. It isn’t strictly defined and can mean different things on different occasions. Whether a portfolio/asset (stock, fund, cash, etc.) is considered managed depends on the purpose of the reporting.
Sometimes only actively managed portfolios (called “discretionary asset management”, where manager decides where and when to invest client money into) are considered managed, but sometimes also funds under advice (where manager only provides recommendations) or administration (where manager provides custody of money, trade services, reporting, and other services).
Sometimes only funds, stock and other instruments are considered managed and cash is not. Some portfolios are being closed but some stock shares are not sold yet due to pending dividends - this will often not be considered managed. Some clients request the manager to hold certain funds (e.g. their own company shares) and those funds can be considered managed or not.
As you can see there can be different kinds of holdings in a portfolio where you can decide to count them as managed or not. In asset management industry even small differences in calculations of holdings can constitute large sums.
I was a leader of the reporting team (IT) and we did many different reports for different purposes (client reporting, regulatory reporting, management information, etc.) where AUM (or similar term) was the key metric. Without a globally agreed definition we had to ask the business owners to provide rules for each report. It was confusing and led to some errors as not everyone was aware of all specific cases and how to handle them. Also, applying changes across all the tens or even hundreds of reports was very very difficult and time consuming.
Solution? Identify reports showing AUM (or valuations, holdings, etc.), identify different rules (e.g. one set of rules for regulatory reporting, another for client reporting, yet another for fees etc.), provide meaningful and unique names for those rules (e.g. Assets Under Management, Assets Under Advice, etc.) and provide detailed definitions that would be meaningful to business users as well as IT reporting staff.
Ship repair / procurement
I was an architect of a data warehouse and core reporting for a large ship repair yard. Key resources in ship repair business are materials/spare parts, which come in huge numbers, shapes and forms (there are hundreds and thousands of just pipe collars). Ship repairs are often short projects and start unexpectedly (when something breaks on the ship). Keeping spare parts generates costs for the shipyard, but each day of the ship being out of duty can cost a shipowner tens of thousands of dollars per day. Efficient inventory and timely supply of spare parts and materials are key to shipyard profit and customer success.
One of the key concepts in procurement in a shipyard is a material requirement, which specifies the exact index, unit and required amount. But the thing is that in different contexts, by different people (project manager, buyer or storekeeper) these metrics can be understood as:
- Amount of material required for the entire project
- Amount of material required for the specific position (an item of work)
- Amount of material required still to be assigned moved to the project - purchased and/or assigned in the inventory
- Amount of material required to be purchased for the project
- and a few more variations...
Using the same term for these radically different metrics led to some issues with the procurement process. It caused both under and over-purchase of materials.
Solution? Identify key processes (procurement, material specification, project-oriented inventory, etc.) and what is important to track in each of them (total amount of material required for the project? Amount of material that needs to be allocated to project? Amount of material that needs to be purchased?), identify what metrics are critical for each of them, provide unique and meaningful name, definition and calculation and share this glossary in all departments.
Summary
It’s fascinating how many problems in analytics could be solved with a simple business glossary and how universal this truth is throughout the economy. Problem is that so little businesses, projects, consultants and managers see its importance or even are aware of the idea.
How is it in your organization and organization of your clients?


 Piotr Kononow


