


 Piotr Kononow
This is a quick tutorial on how to create ER diagram for your existing relational databases with Dataedo in just a couple of minutes.
What you get
Here's a summary of what you can gain using Dataedo for your diagrams:
- Easily create small manageable diagrams for your databases (even the large and complex ones)
- Share diagrams in interactive HTML pages easily
- Explain and document table relationships and joins
- Keep diagrams in sync with database schema
- Hide unnecessary information from (columns, joins)
- Keep all diagrams in shared repository (for all databases and DBMSes)
- Build definitions and descriptions of all tables and columns in shared repository
Prepare
First you need to download and install Dataedo on your computer.
Dataedo has two options to store metadata:
- In a local file
- In shared repository - advised (requires SQL Server)
If you want to get started with this tutorial quickly then try the file first. To create file repository click Create file repository button on the welcome screen.
1. Import database schema
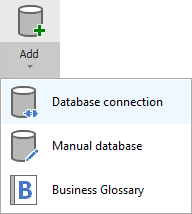
Now you need to connect to your Amazon Redshift database and add new documentation to the repository. Click Add documentation and choose Database connection.
Now choose Amazon Redshift DBMS, provide connection details (more on that here) and follow wizard to import schema to the repository.
2. Create module for diagram
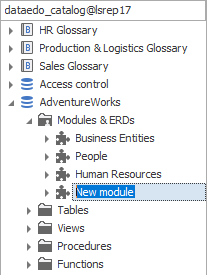
Diagrams in Dataedo are held in so called "modules". Modules are objects existing solely in Dataedo repository and are used to organize databases into smaller pieces, document subject areas or create diagrams. You can have unlimited number of modules (diagrams) and diagrams can contain entities from entire repository (you can create cross-database diagrams).
In the repository explorer Modules & ERDs under documentation element, right click and choose Add module/ERD. Enter name and confirm with Enter (to change name press F2).
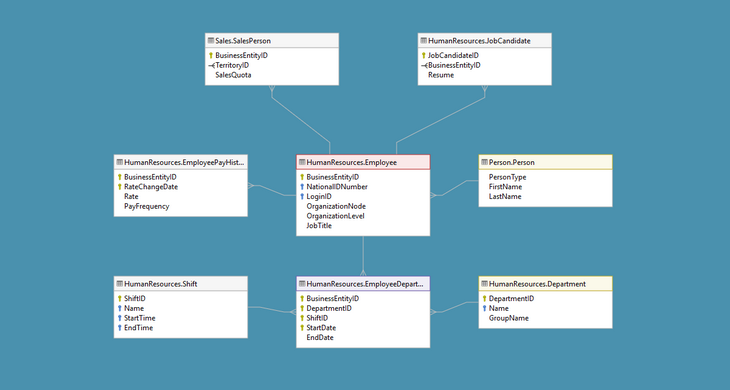
3. Add tables to diagram
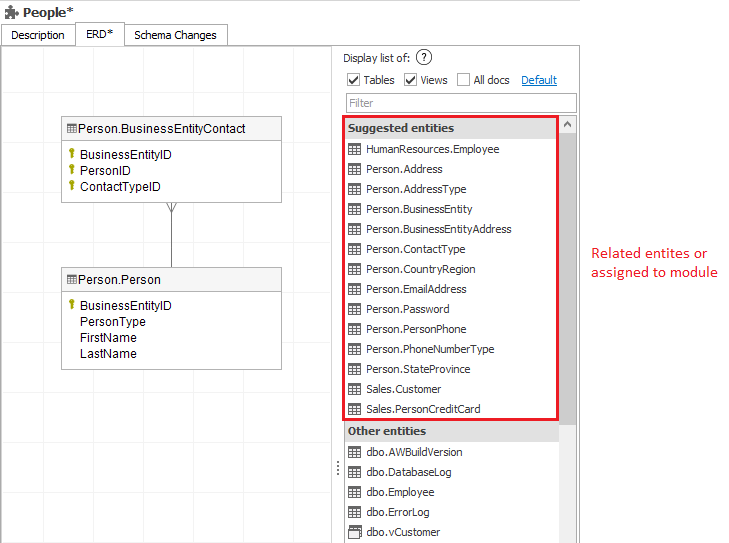
Now, as we have a module, we can start creating our ER diagram. Let's move to ERD tab with diagram pane and a list of available entities (on the right). This list includes all entities (tables and views) in the repository and highlights the ones linked to the ones already on the diagram and the ones assigned to this particular module (module groups tables and other objects). You can use search field to find specific table by its name.
To add table to the diagram double click item on the list.
4. Choose columns to show
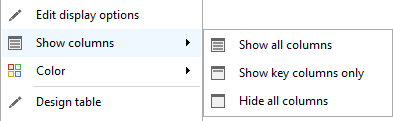
By default, only key columns are included in the diagram, but you can decide which columns you'd like to show. You can decide for specific column, table or entire diagram. Simply right click entity or blank diagram pane and choose one of the options:
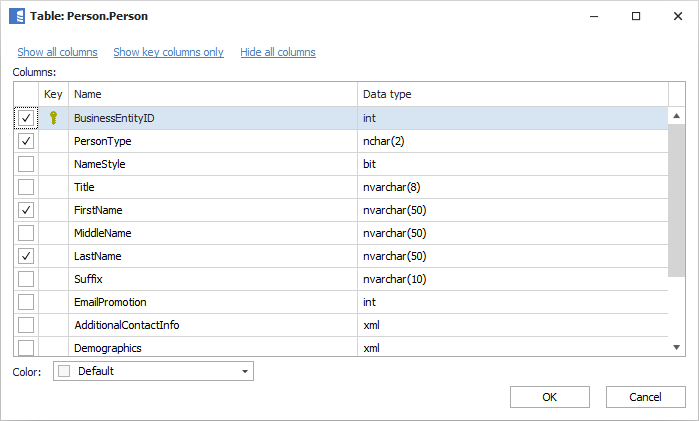
or double click entity on the diagram to switch visibility of specific columns:
5. Add missing relations
One of the key benefits of diagrams in Dataedo is the ability to supplement table joins that have no foreign keys defined in the database. You can create manual relationships between tables (and views) that would be only preserved in Dataedo repository (with no impact on the database).
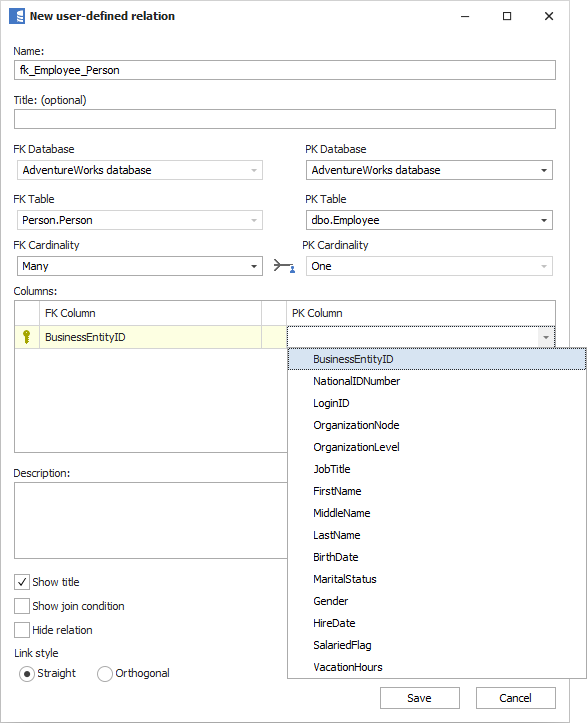
To define new relationship right-click child table, choose Add relation, drag to parent table and left-click.
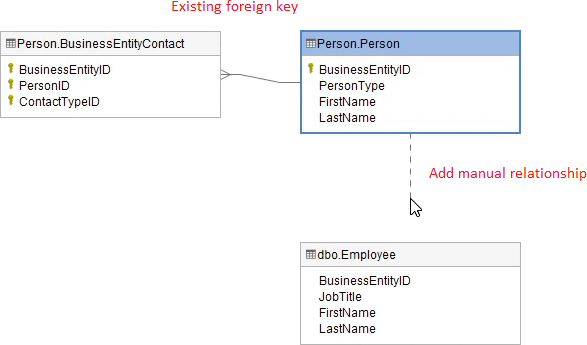
And define join columns.
Manual relationships are displayed as dotted lines.
Those relationships are stored globally in the repository and can be reused on other diagrams and are part of the data dictionary.
6. Hide joins
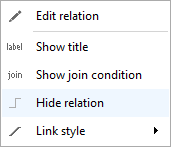
There is also an opposite functionality - to hide some links from the (specific) diagram to hide unnecessary information.
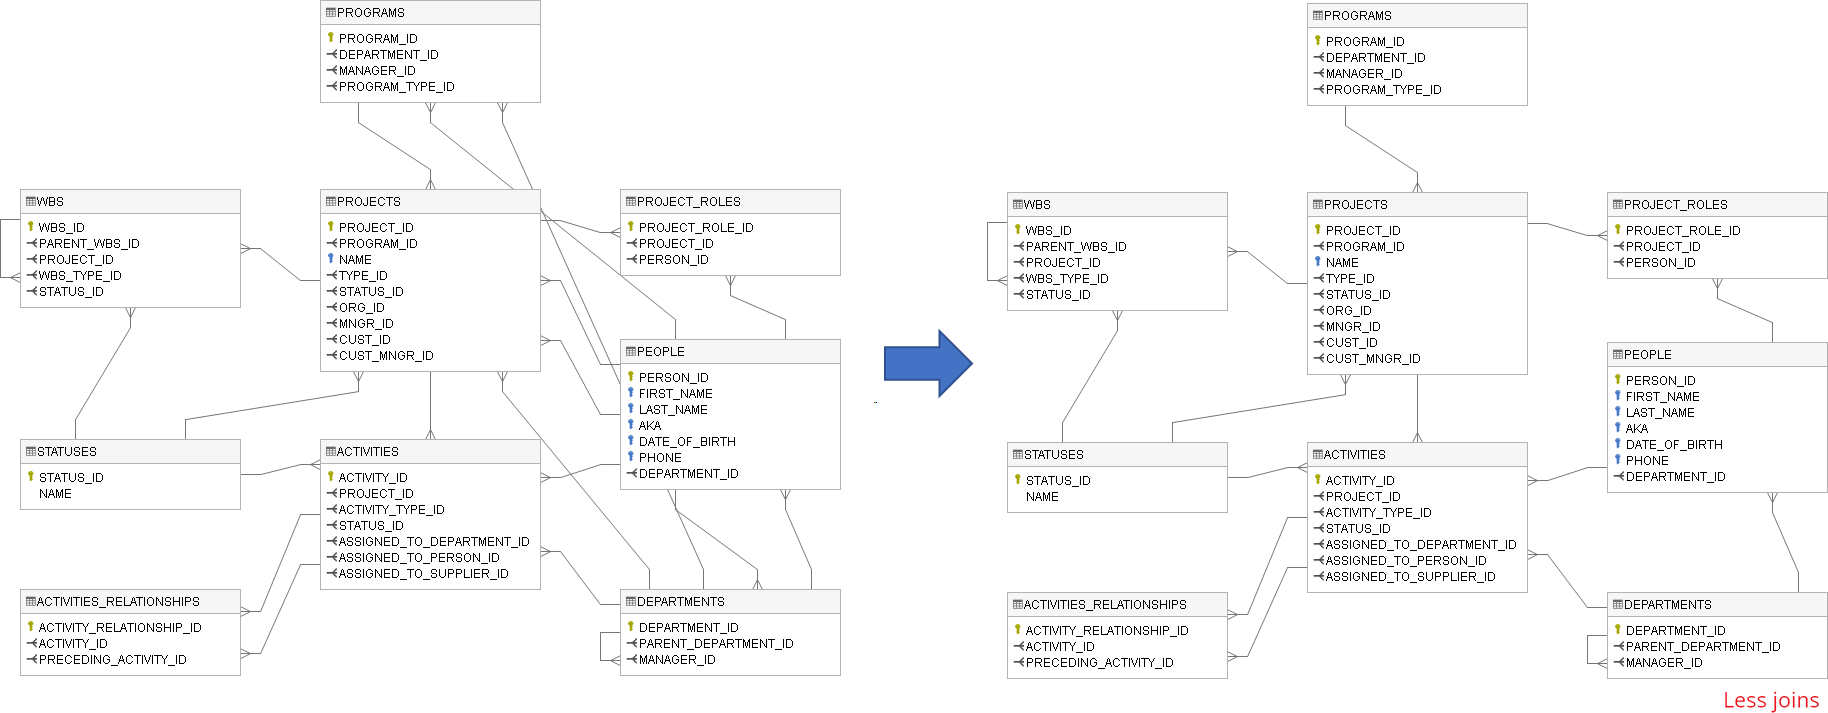
To hide relation right-click it and choose Hide relation option.
The effect is the following:
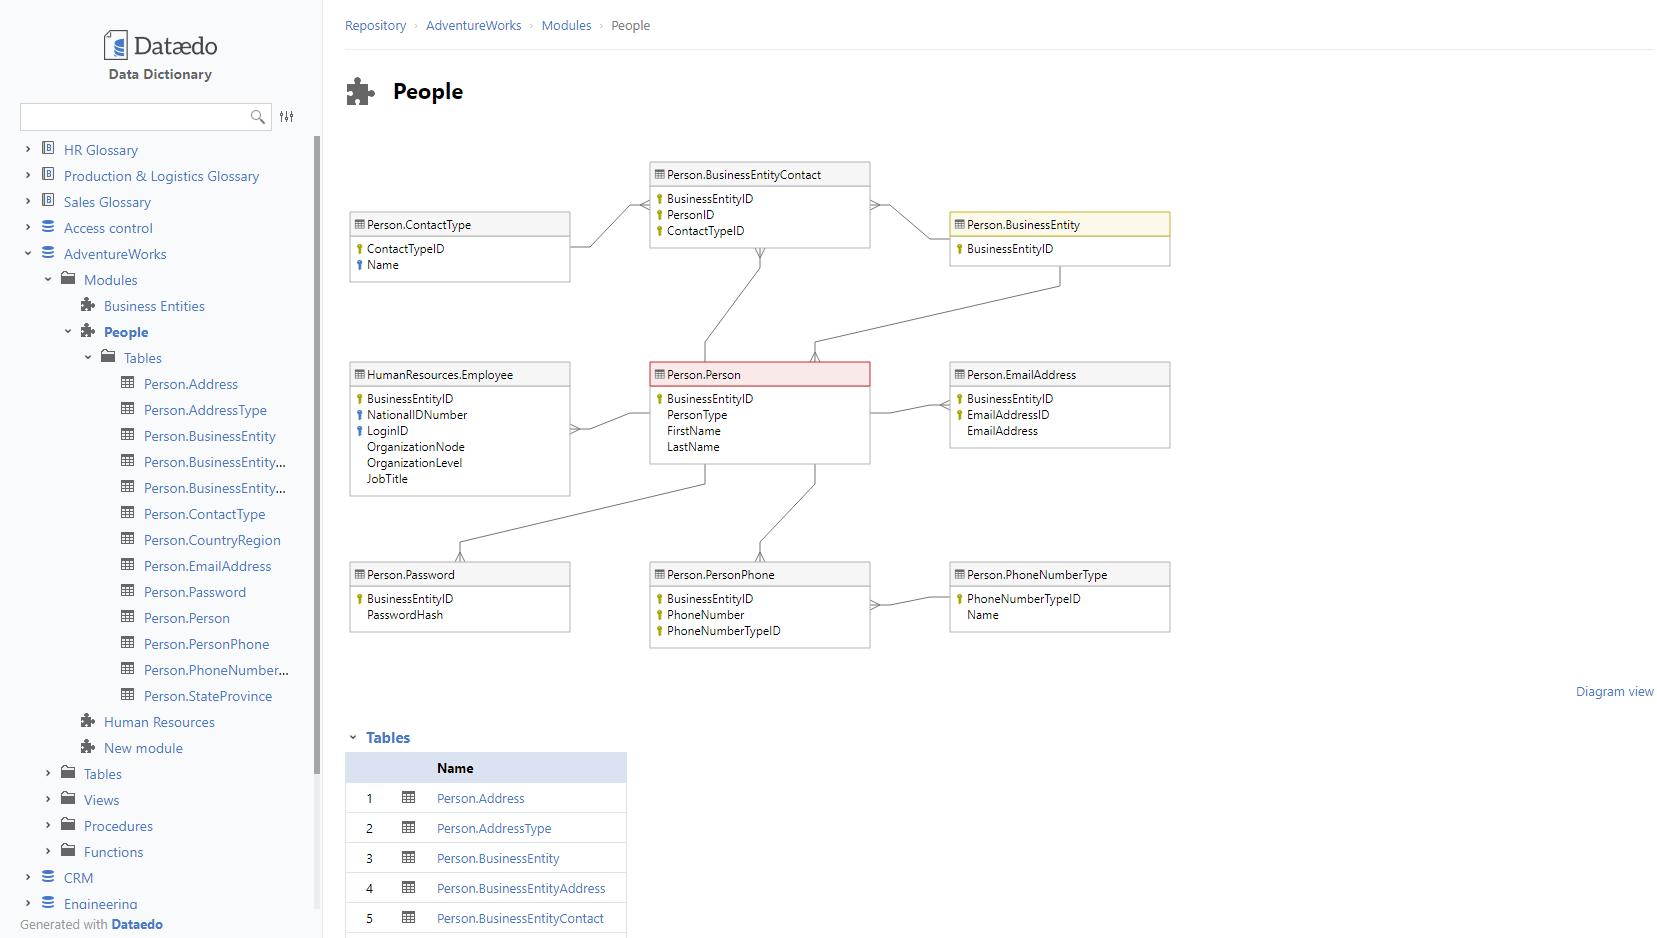
7. Export and share
And now, one of the key functionalities and benefits of Dataedo - exporting to interactive HTML. This is important for you because you can easily and conveniently share diagrams with complete data dictionary documentation with your team and organization.
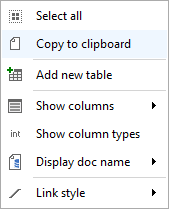
You can also copy diagram to clipboard. Right-click blank part of diagram pane and choose Copy to clipboard option.
More capabilities
A few more capabilities you might be interested in:
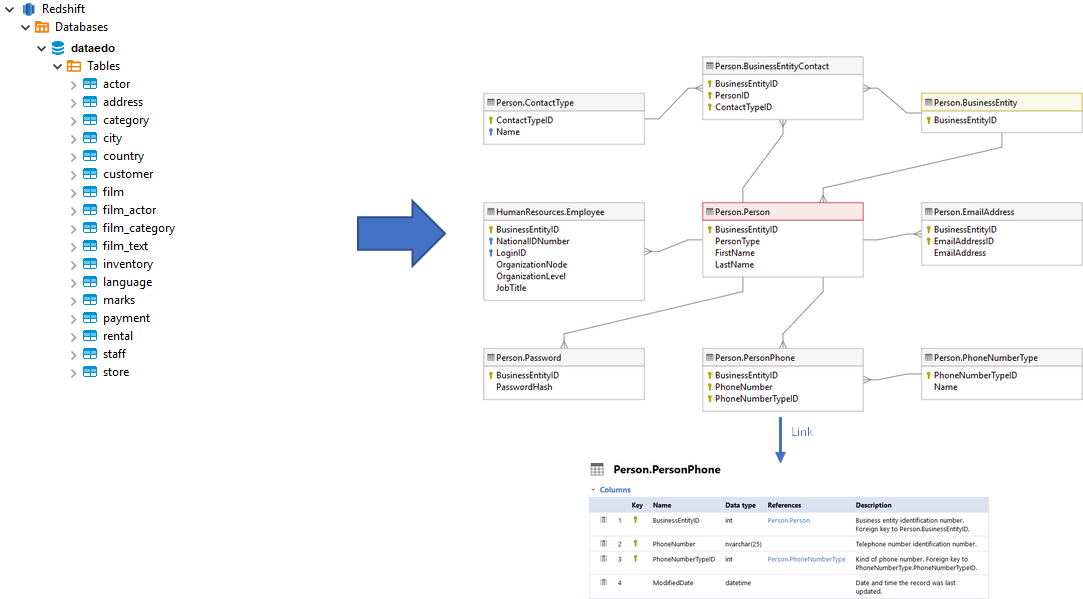
- You can include column data types
- You can show join conditions of specific links
- You can include views on the diagrams and create joins for them as well
- You can color entities
A few tips
- Keep your diagrams small, we would suggest under 20-30 entities,
- ERDs may overlap, table can appear on one than one ERD,
- Combine ERDs with a Data Dictionary to document and explain your databases.