 Rene Castro
This tutorial will show you how to create a diagram for an existing DB2 database using IBM Data Studio.
There are two options to do it.
Option 1: Data Source Explorer
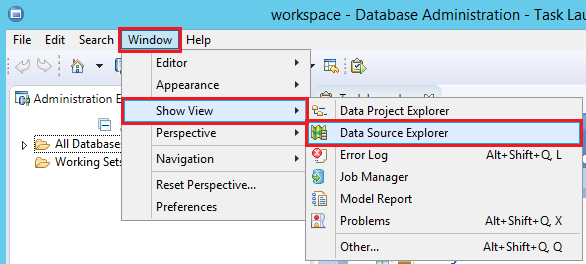
You can create the diagram of your existing database from the Data Source Explorer. If this window is closed, you can open it in the main menu using the options Window > Show View > Data Source Explorer.
To create the diagram, do the following:
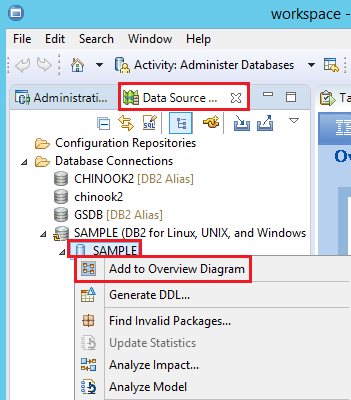
- In the Data Source Explorer right-click on the database and select the Add to Overview Diagram option.
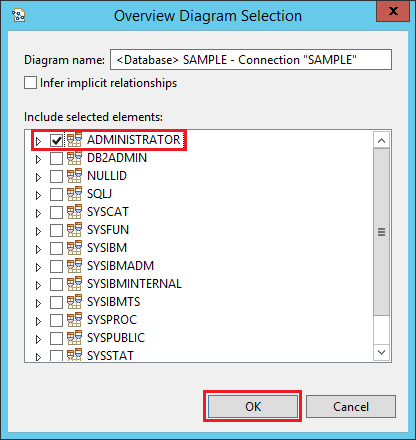
- In the Overview Diagram Selection dialog choose schemas and objects that you want to be included in the diagram and click OK button.
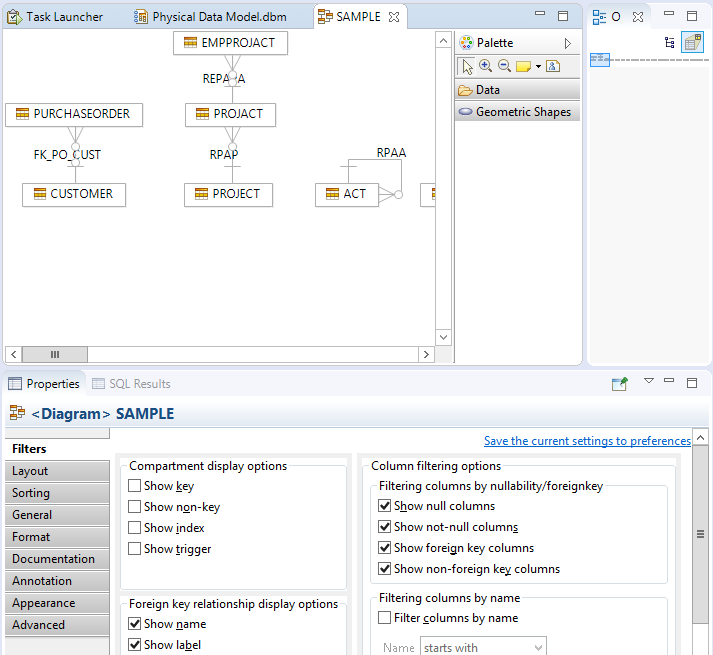
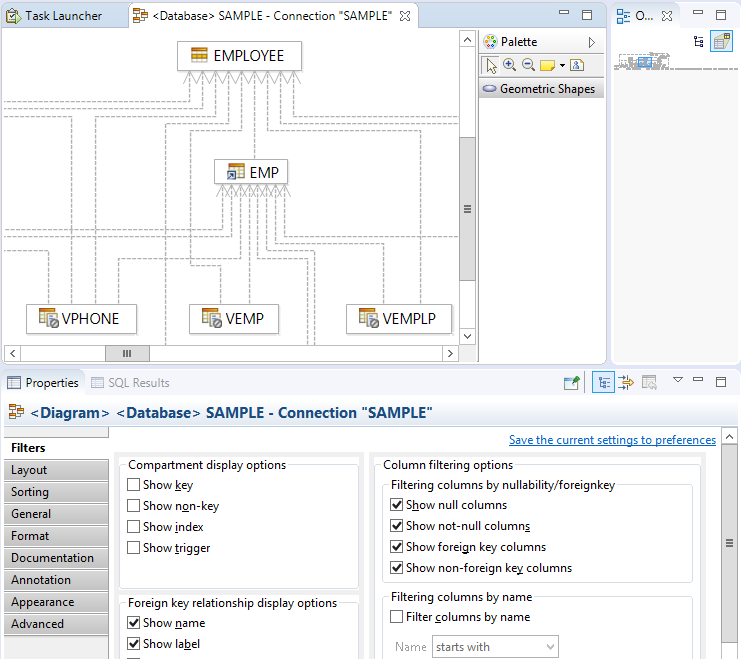
- A window that shows the progress of the operation appears and then the diagram is displayed in the upper right-side pane, while its properties are displayed below.
Option 2: Data Project Explorer
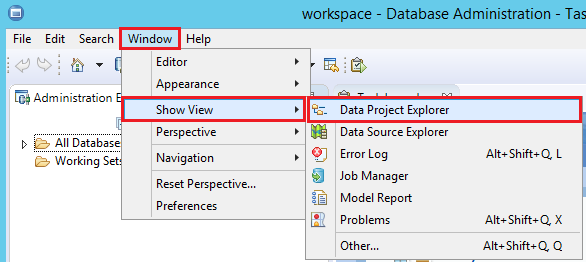
You can also create the diagram for your existing database from the Data Project Explorer. As the previous section, if this window is closed it can be opened in the main menu using the options Window, Show View and then selecting the Data Project Explorer option.
To create the diagram from this window, do the following:
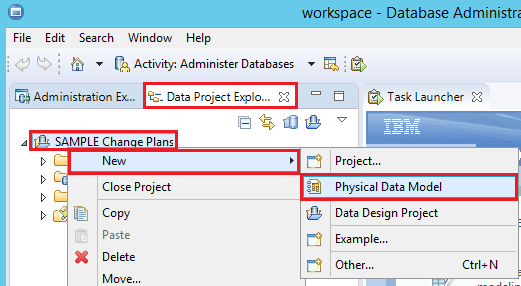
- In the Data Source Explorer, right-click on the Change Plans node of the intended database and select the New, Physical Data Model options.
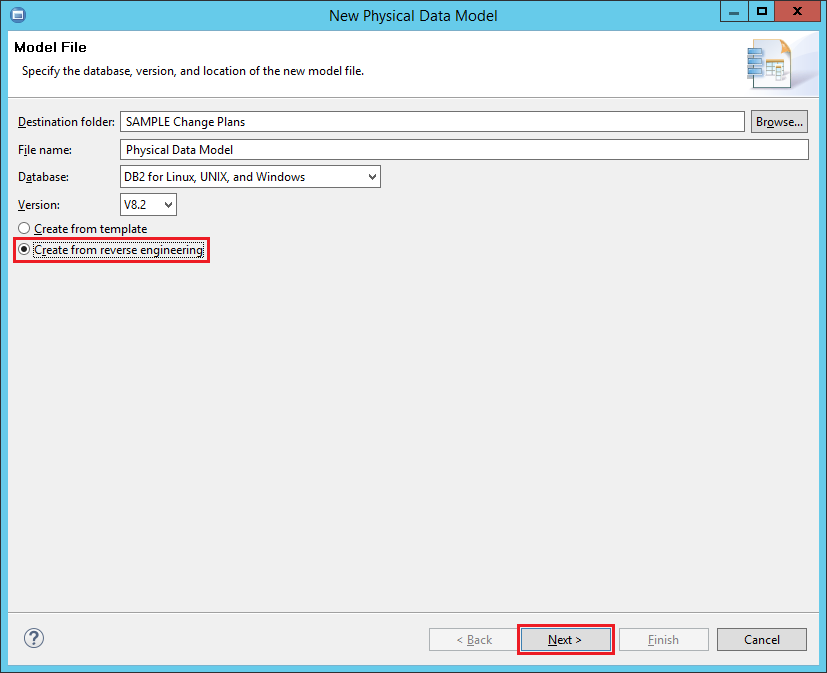
- Select the Create from reverse engineering option, leave the information shown as it is and click on the Next button.
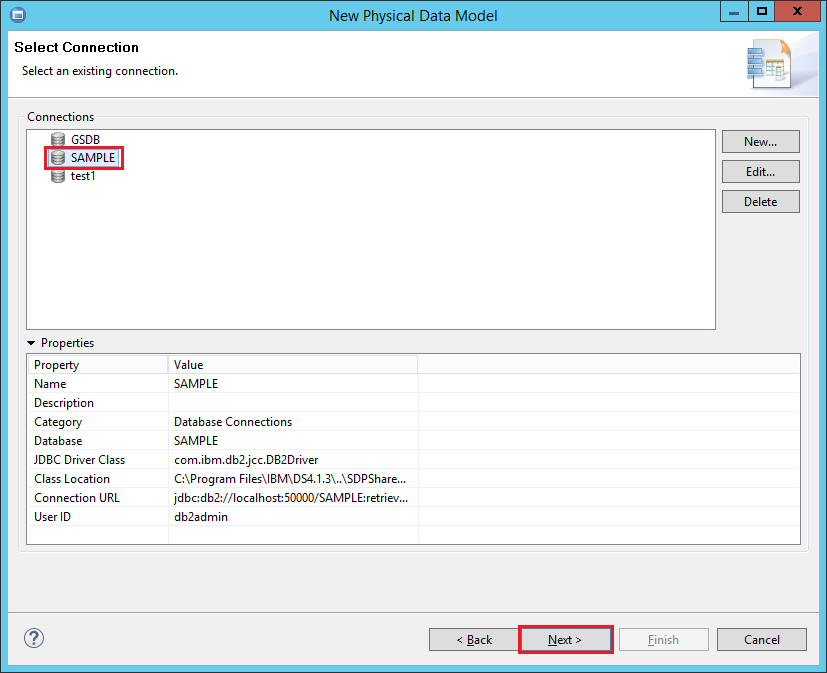
- Now select the connection and click on the Next button.
- Then select the schema to reverse engineer.
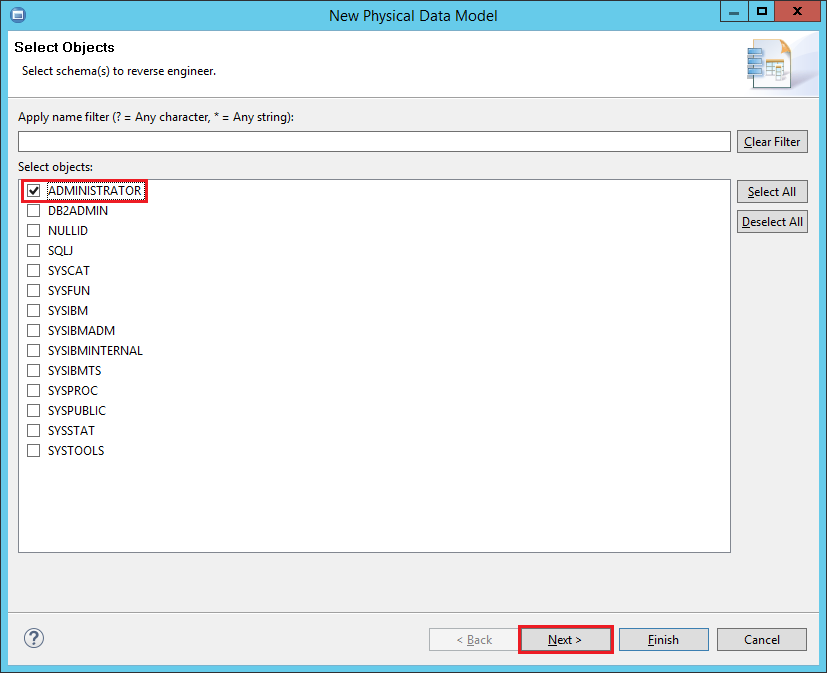
- The Finish button is now enabled and you can click on it to immediately start the creation of the diagram using the default elements selected for the database. In this tutorial we use the Next button to explore these database elements.
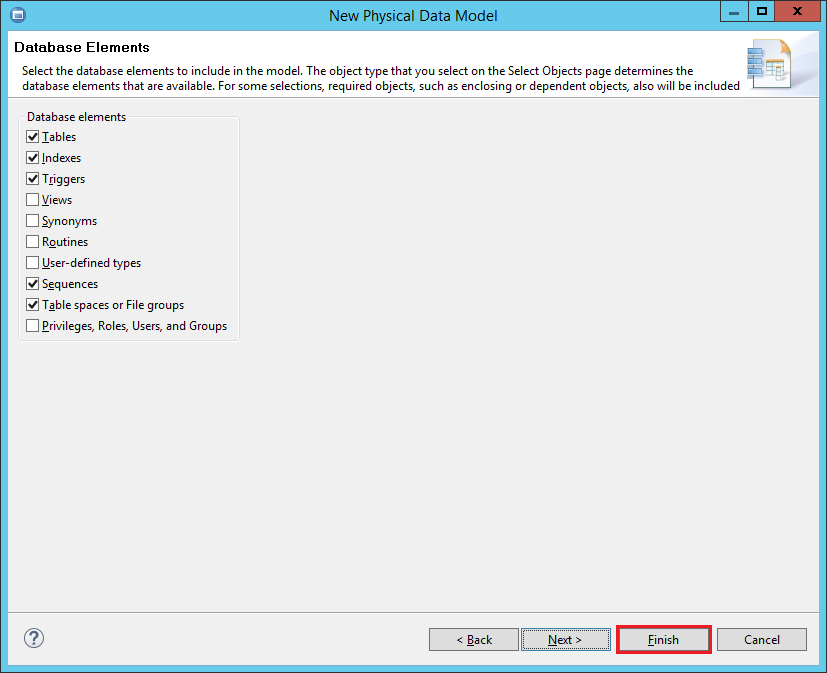
- The Next button allows you to configure additional options. In this tutorial we use the Finish button to generate the new diagram. A new physical data diagram and a physical model appear in the Data Project Explorer.
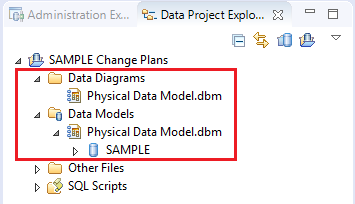
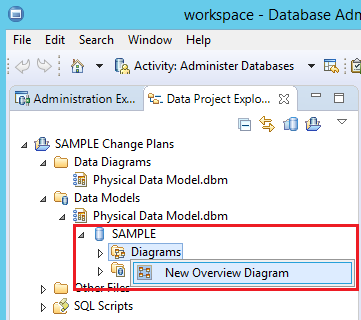
- Expand the Physical Data Model (SAMPLE in this tutorial), right-click on the Diagram folder and select the New Overview Diagram option.
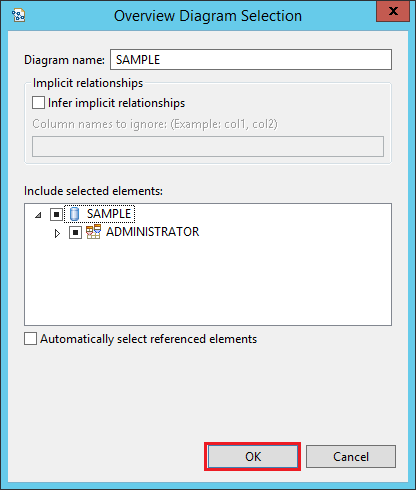
- In the Overview Diagram Selection window make sure that the elements in the Include selected elements section are selected and then click on the OK button.
- As described in the previous section, the generated diagram is displayed in the upper right-side pane, while its properties are displayed below.