Some of you who find Dataedo and want to visualize your databases with ER diagrams ask how are we different from data modeling tools, such as Erwin Data Modeler, Visual Paradigm or Enterprise Architect. I wrote this article to explain what benefits Dataedo provides and what do we do differently.
For documentation and discovery, not for modeling
Let me start by stating the key differentiator - we are not a data modeling tool. Data modeling tools were designed for other purposes - modeling and design of data from scratch, and reverse engineering functionality was mostly an addon to this (in my opinion).
Dataedo, on the other hand, is a tool for discovery, cataloging, and documentation of your existing database ecosystem. You can call it a data catalog (if you want to document an ecosystem of databases) or database documentation tool (if you want to focus on one database) with the ability to visualize data models with diagrams.
Convenient sharing
I think the key difference in our philosophy is the emphasis on sharing of the designs.
Most of data modeling tools out there come from another era. An era when data and databases were for those IT geeks and modeling is one of the magic tricks they do that no one else cares about. That’s why their metadata is trapped in the tool and it’s not easy to share models and documentation with nonusers, non-IT people who would just like to use data rather than waste time installing and learning another tool.
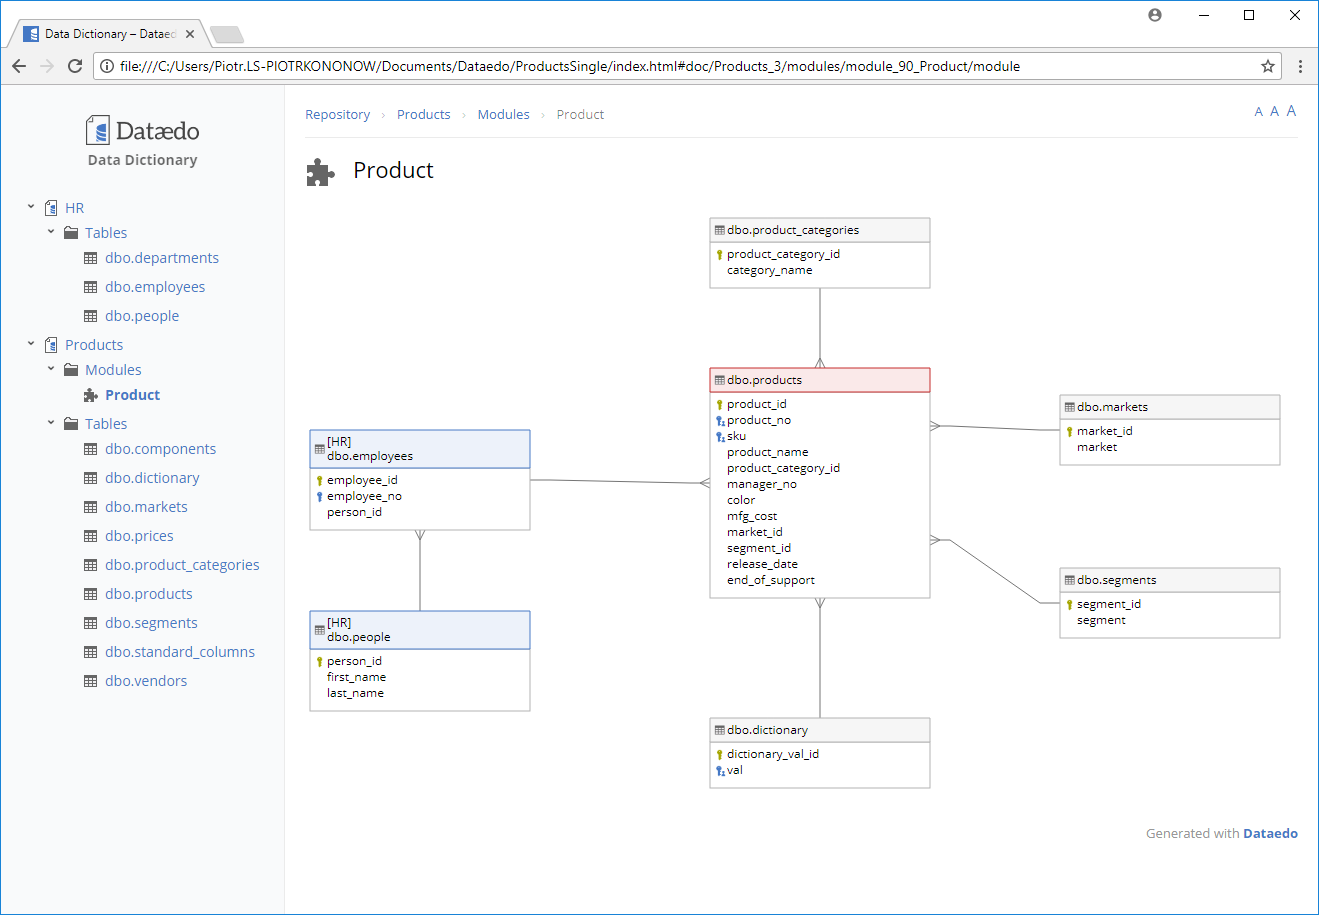
Dataedo puts sharing of documentation at its core. It provides HTML export that includes interactive diagrams integrated with complete data dictionary documentation (and soon will have interactive web portal with powerful search, discovery and collaboration features).
 Export from Dataedo
Data Modeling tools, on the other hand, allow you only to export diagrams as an image.Some allow you also to export data model/dictionary to a clunky HTML page, but… without diagrams. So there is no browsable, convenient documentation you can share.
Here are some examples of exports from popular tools:
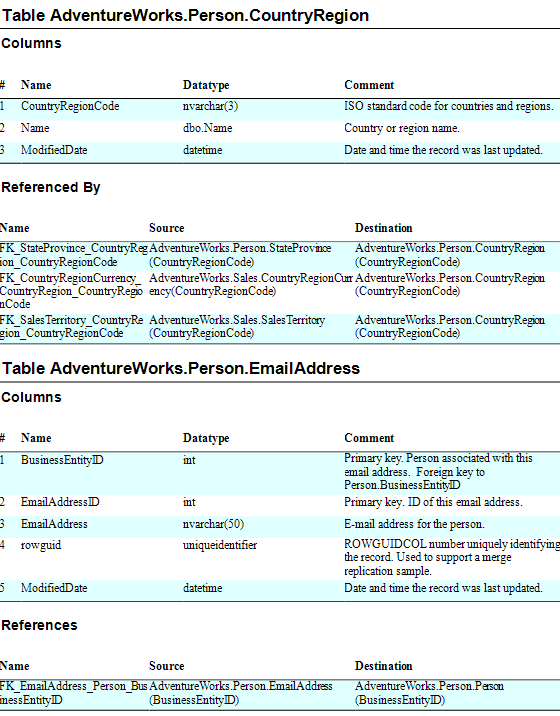
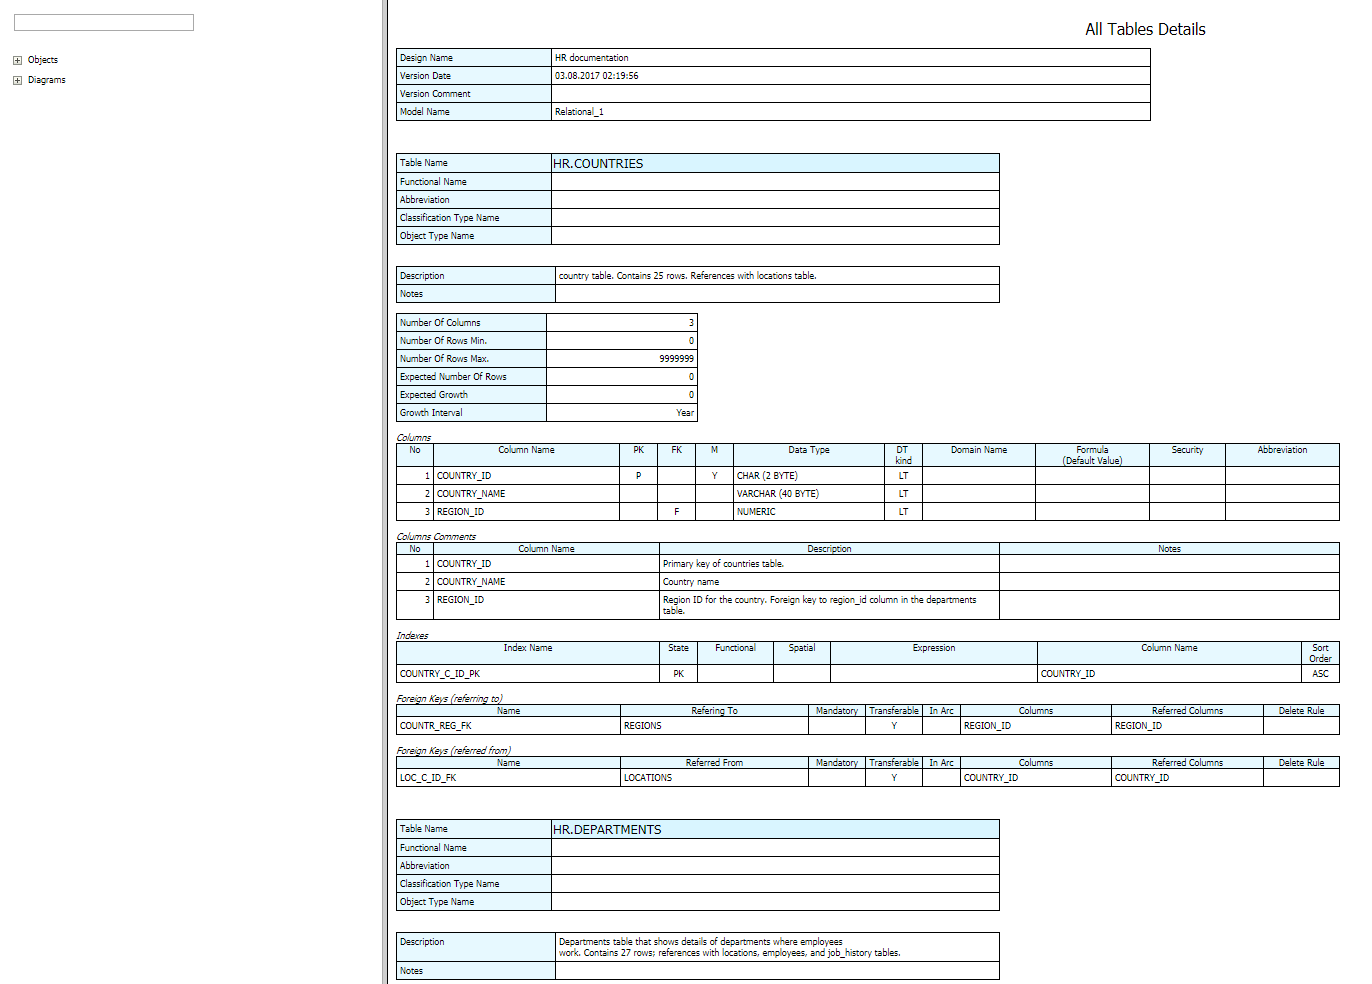 Export from Oracle SQL Developer Data Modeler
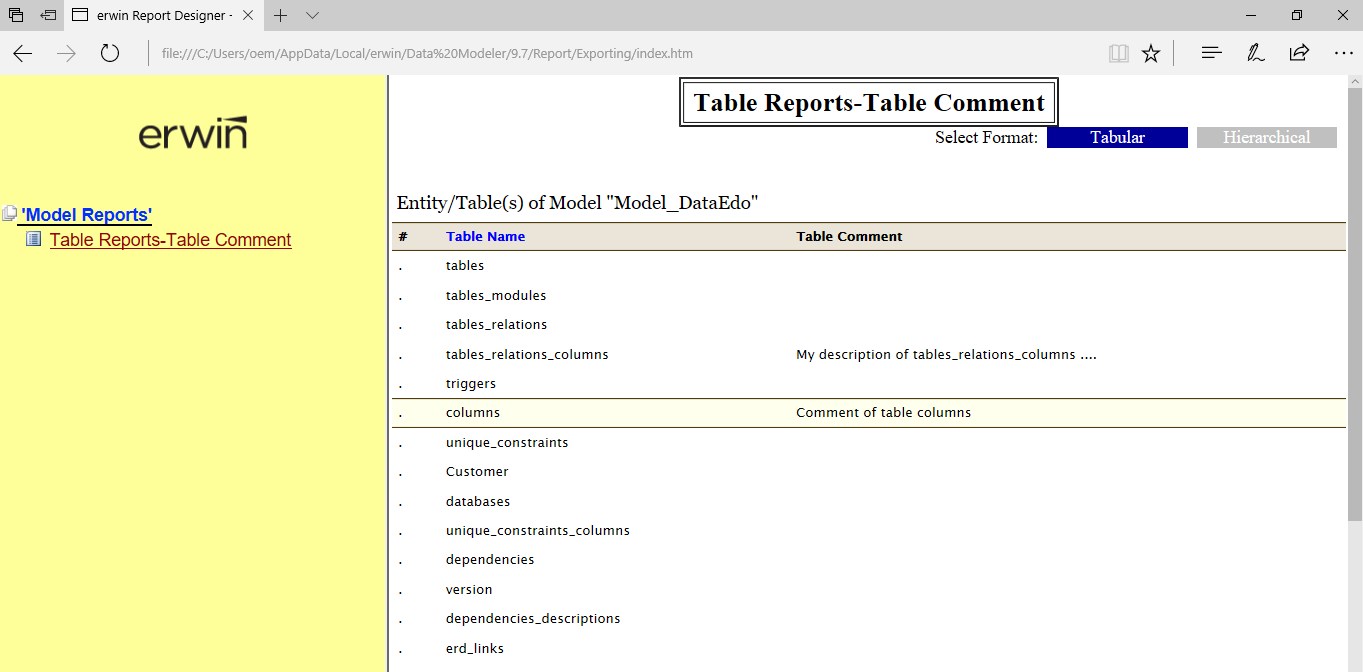 Export from Erwin Data Modeler
 Export from Toad Data Modeler
Easy to keep in sync with database and separation of user metadata
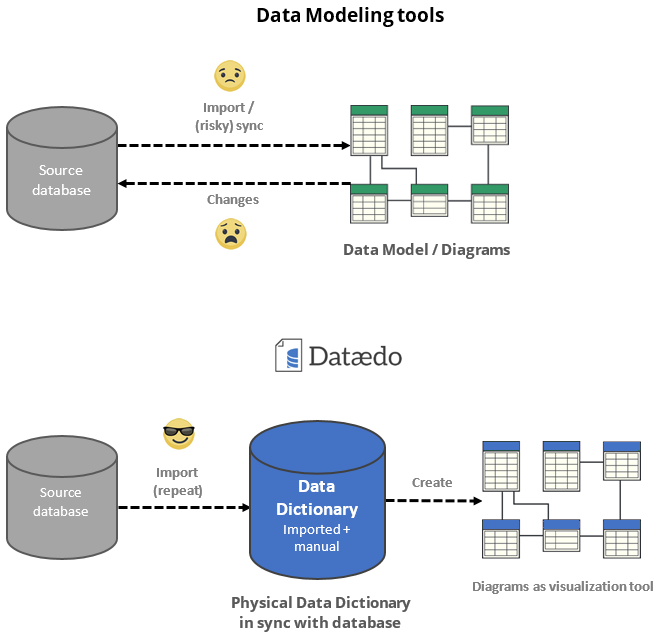
Dataedo also has a very different philosophy in its approach to the handling of metadata and the connection to source databases.
At the core of data modeling tools are models or diagrams. Users can import the data structure from existing databases to the model and that is easy and safe (it’s called reverse engineering). They can and also sync changes from the database, but that is a serious step where users should be cautious because they can either change database structure by mistake or lose their metadata (like manual relationships)!
Here is a sample window from Oracle SQL Developer Data Modeler where user has a lot of options and decisions to make.
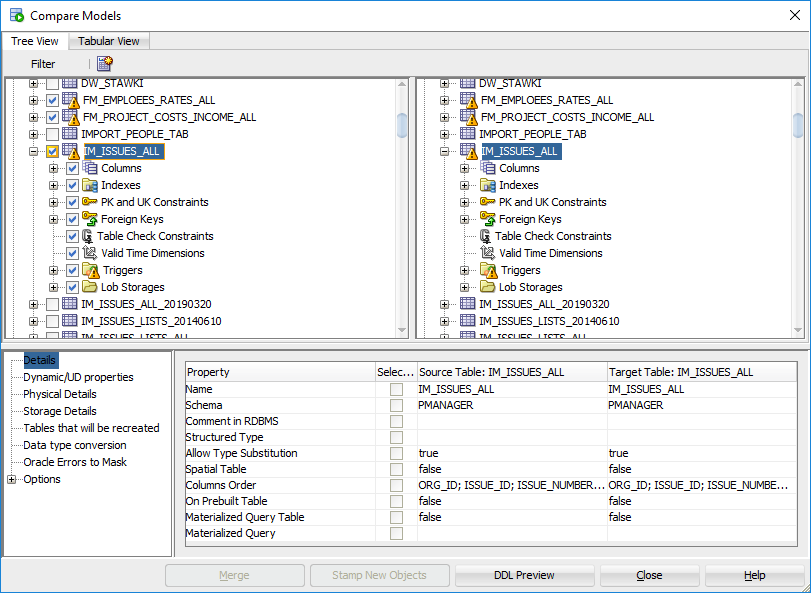 Sync window in Oracle SQL Developer Data Modeler
Dataedo, on the other hand, allows easy, stress-free import of changes from the database to its data dictionary. This physical data dictionary is at the core of metadata in Dataedo. It holds all tables, columns, relationships imported from the database and adds all new elements without unnecessary questions. The assumption is that you want to have a reflection of a database schema in Dataedo repository.
But that’s not all, Dataedo separates physical data model imported from the database form user-generated metadata, such as descriptions, table relationships, primary/unique keys or manual data elements (tables or columns), that are not impacted on subsequent import. So hitting that sync button will never destroy your work.
Diagrams as stories, rather than reference documentation
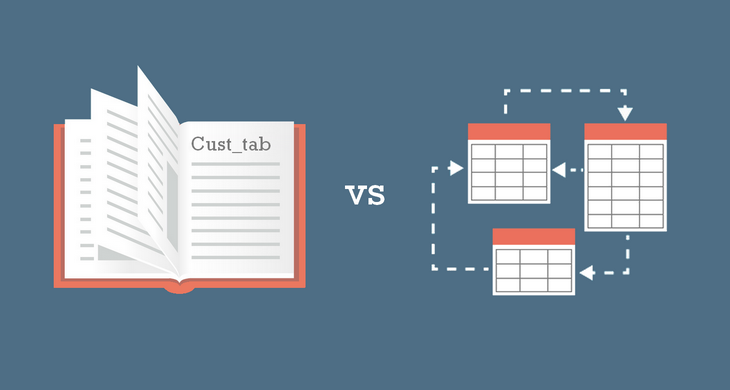
We at Dataedo believe that diagrams are not suitable as reference documentation of a database. Diagrams are good for telling stories and quickly building models in our brains. ERDs are good for showing us key tables, their key columns and the relationships between them. Note the emphasis on “key”. You don’t need to see all the tables and attributes to understand the model. As a matter of fact, the more details you see, the less you are able to grasp and understand. Which of these pictures better communicates what kind of structure you are dealing with?

Dataedo allows you to:
- Create multiple small diagrams
- Choose columns to show on a diagram to hide the complexity
- Hide selected relationships
So you get this:
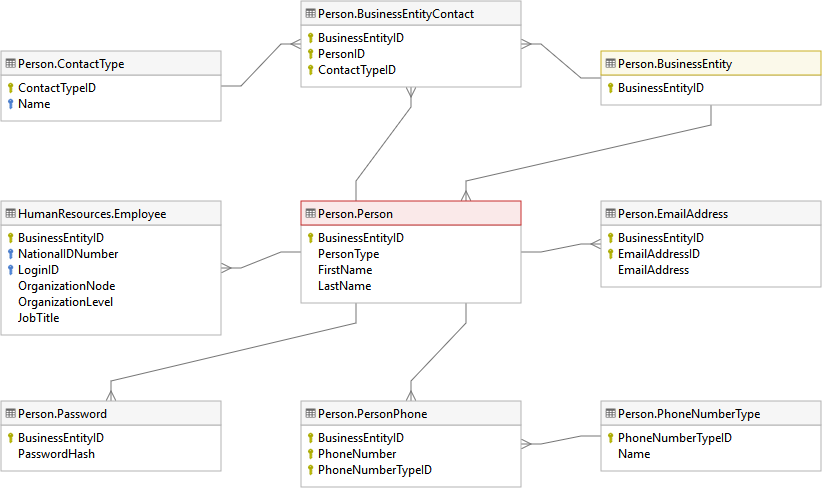 Diagram in Dataedo
Instead of this:
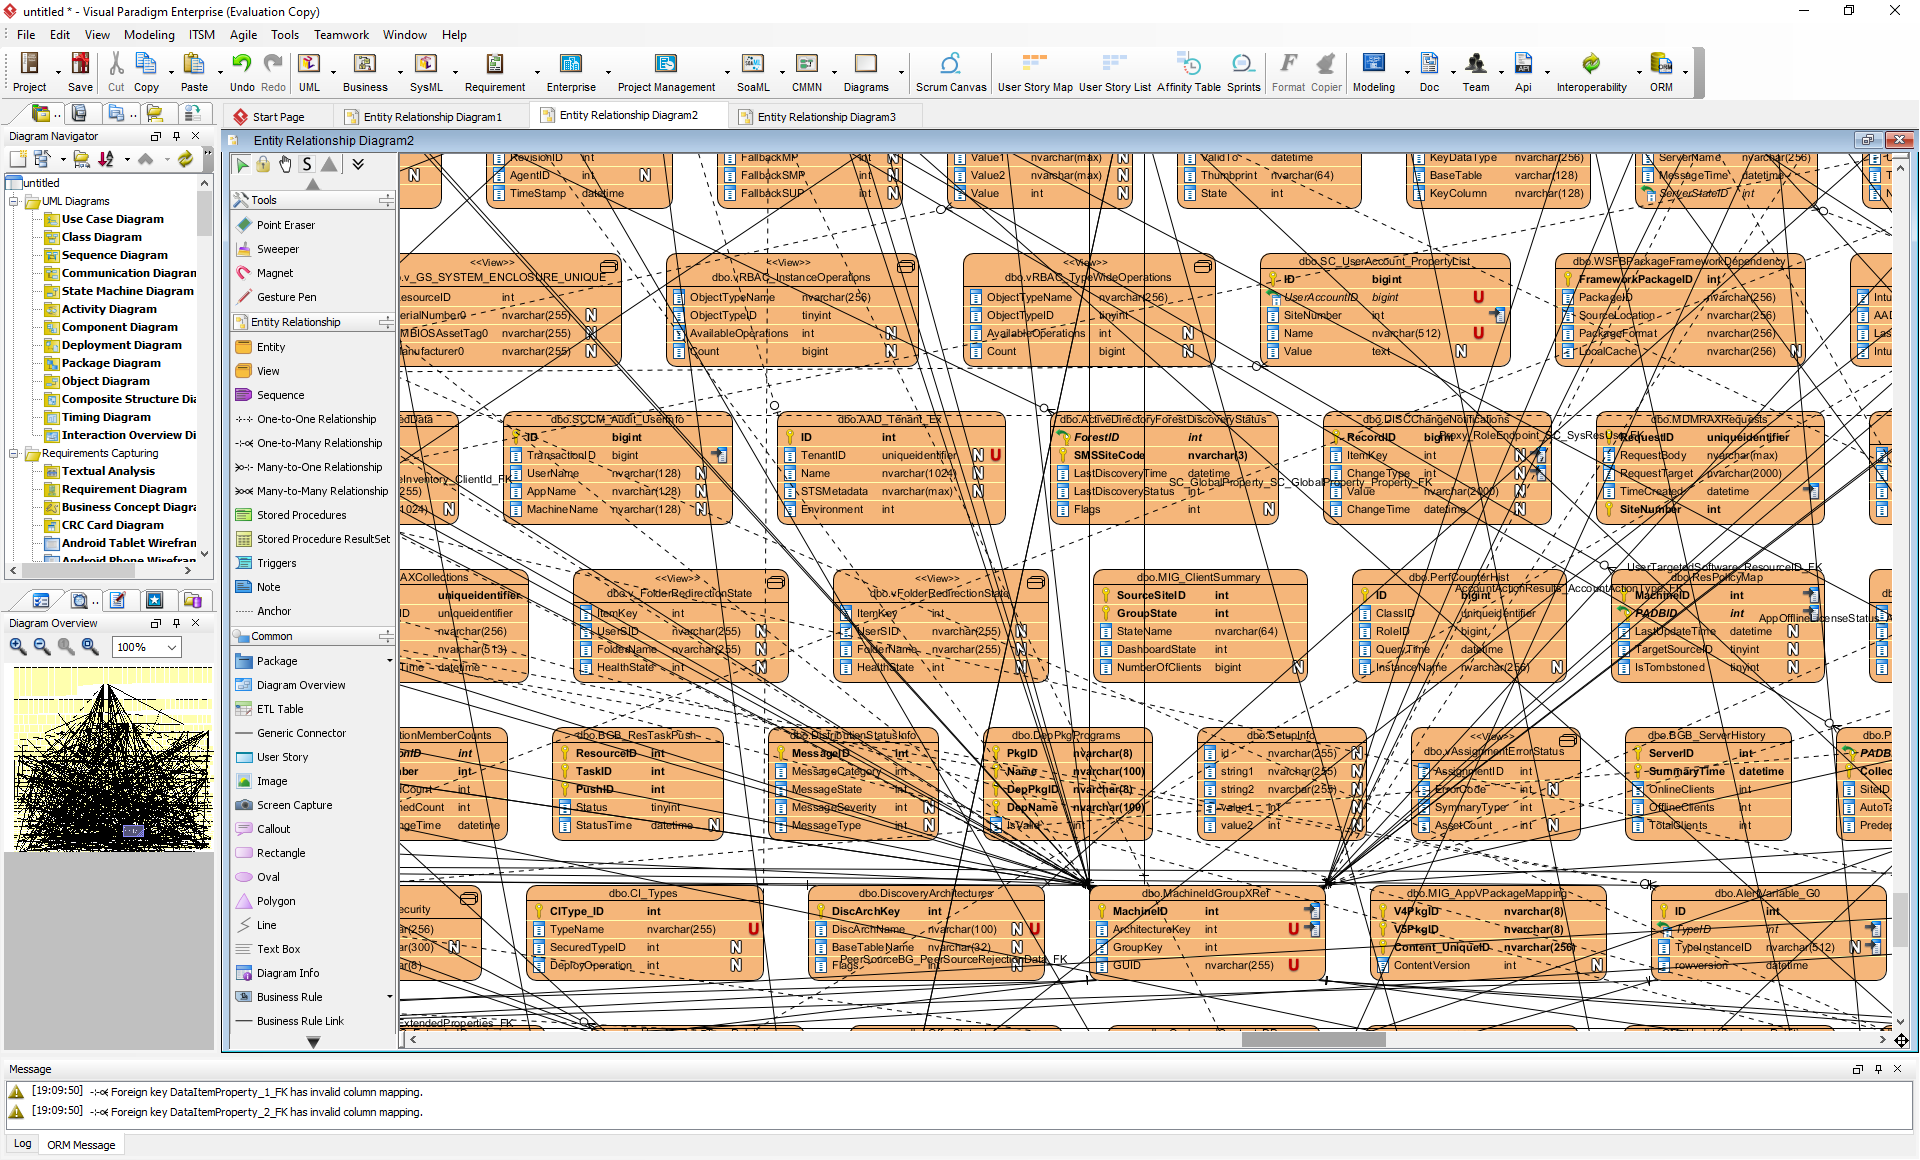 Diagram in Visual Paradigm
Comprehensive data dictionary editor
Data modeling tools allow you to provide descriptions for tables and columns. The devil is in the details - how those tools allow you to enter descriptions and what can you do with those descriptions after you have them in the model.
In virtually all of the data modeling tools adding comments for the columns in the entire data model is very impractical, and I bet it’s almost never done. You need to open properties of each table, select each column, and sometimes open another properties box.
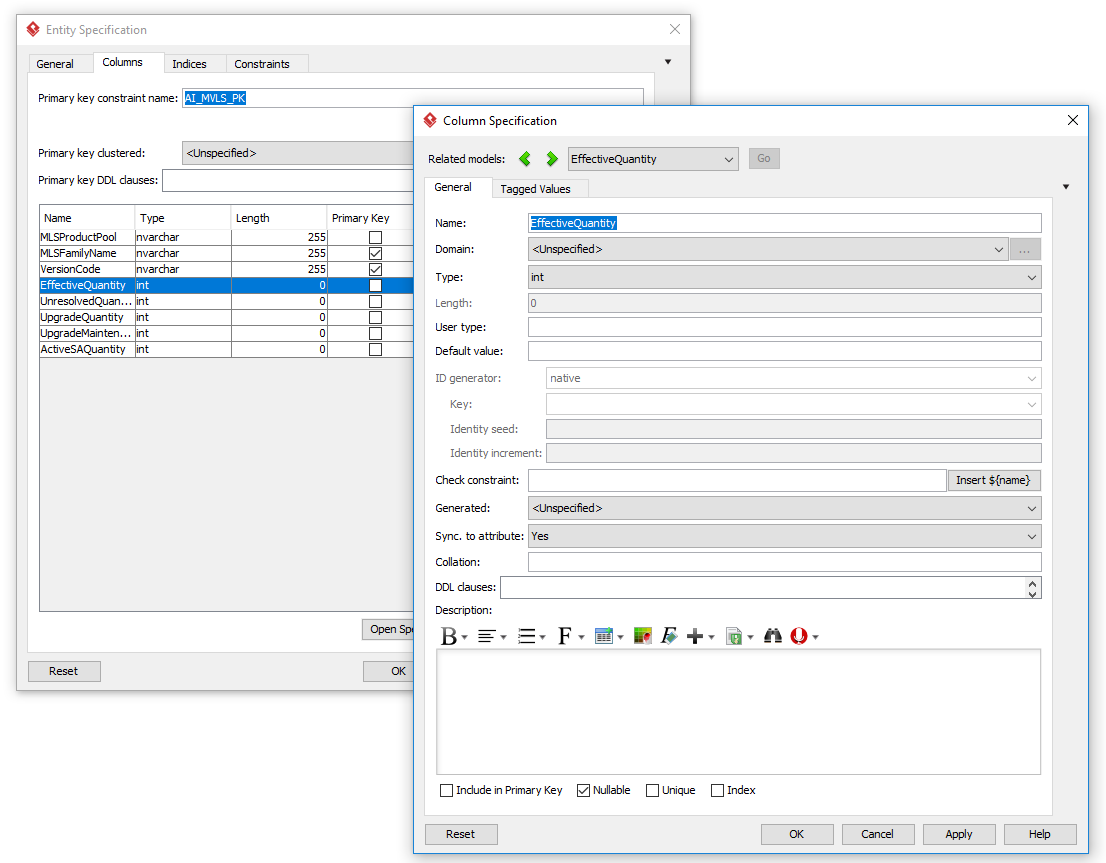 Column description editor in Visual Paradigm
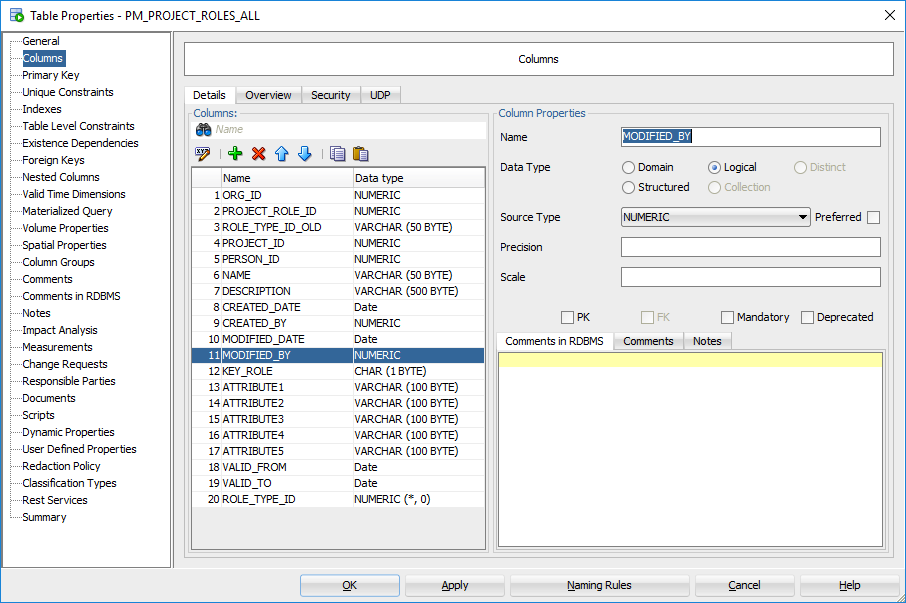 Column comment editor in Oracle SQL Developer Data Modeler
Dataedo provides a convenient editor where you can:
- View and edit comments of all table's columns in one convenient window,
- View progress of the documentation and quickly see which fields are empty,
- Add custom metadata fields in the same convenient editor,
- Choose from text suggestions based on other fields,
- Edit all columns with the same name in entire repository at once!
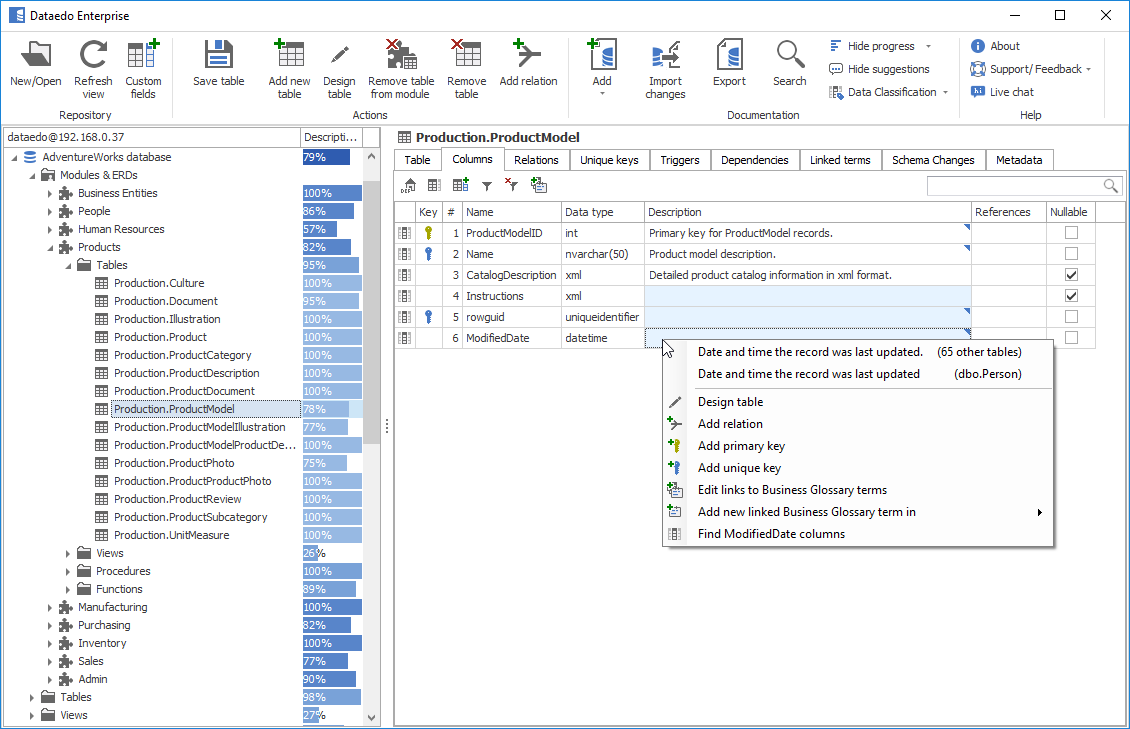 Dataedo data dictionary editor
And then share it easily in interactive documentation pages:
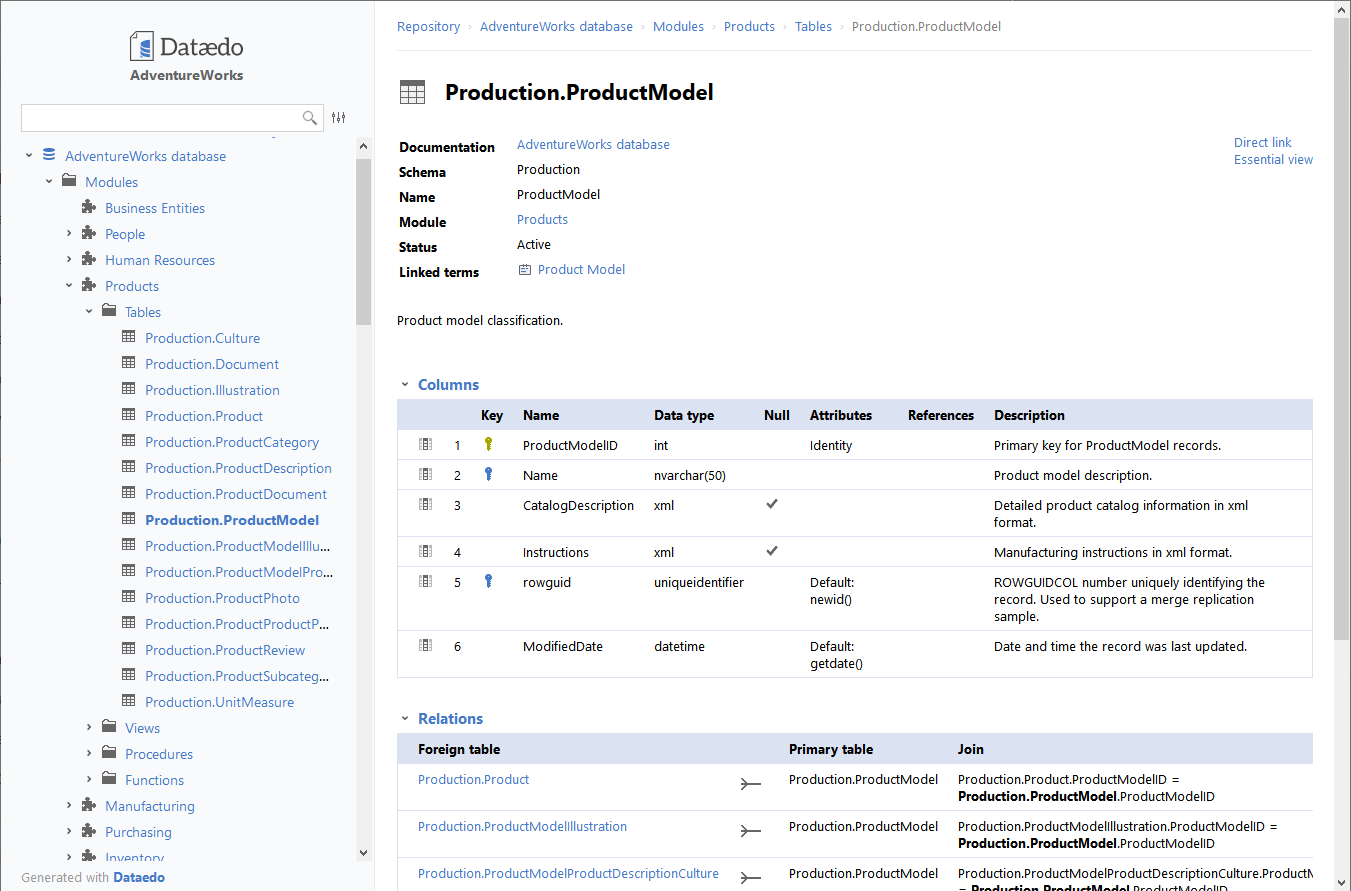 Dataedo HTML documentation export
Collaboration with a central repository
Many data modeling tools work with projects on a local disk that you can version and synchronize (which is actually cool). Dataedo, on the other hand, allows you to all work on the same repository at the same time making collaboration and management of the documentation easier.
More differences
There are some other features that make Dataedo different, but I wanted to focus on the one above. Features worth mentioning are:
- Business Glossary
- Tracking changes in the database schema
- Organizing tables into modules
Conclusion
I hope I managed to show you the key differences and benefits of using Dataedo for the documentation of your data ecosystem. I believe you see now that Dataedo is a completely different beast and not just another data modeling or diagramming tool. If you need to create a simple model, diagram or design new database it is not the tool for the task. But if you want to create useful documentation that will allow others to use data more efficiently and become more data-driven then I suggest you waste no more time try it yourself for free now.