Troubleshooting
Failed or not 100% success
Data Profiling is executing multiple queries on the database, to calculate metrics, gather values, etc.

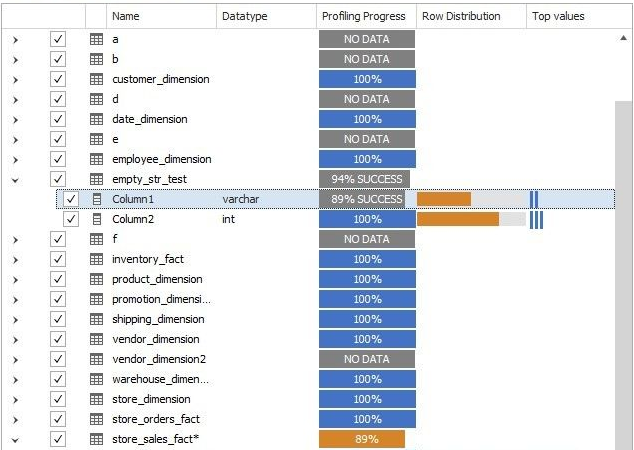
Some of the queries might occasionally fail or timeout. Prior to Dataedo 10.2 when one of the queries failed, whole column or table profiling failed. Starting from Dataedo 10.2, in such case instead of the FAILED or 100% indicator, you will see x% SUCCESS where x is the calculated percentage of finished queries.
You can try to rerun profiling.
Error log
To find out which queries fail, run Dataedo with /errorlog option.

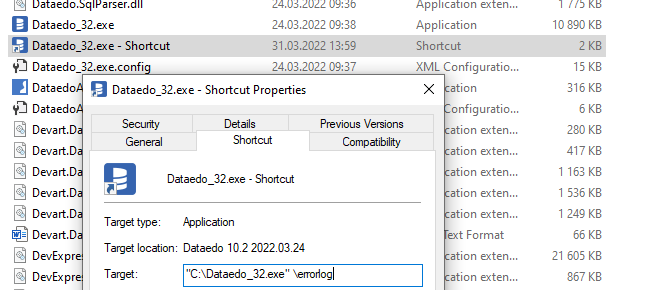
You can change the shortcut to Dataedo and add a parameter in the "Target" input.

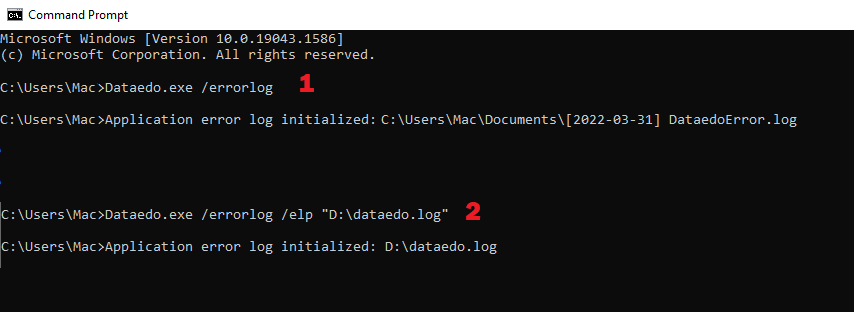
Or you can alternatively run Dataedo from the command line, adding the parameter. By default log file will be localized in your documents, but you can change that with the elp parameter.
Known problems
Minimum date
File repository do not support datetime2 type, so minimum date is year 1753. The problem has been fixed in Server Repository with version 10.2


 Mac Lewandowski