
Join 1000+ Satisfied Customers Using Dataedo


See where your reports really come from
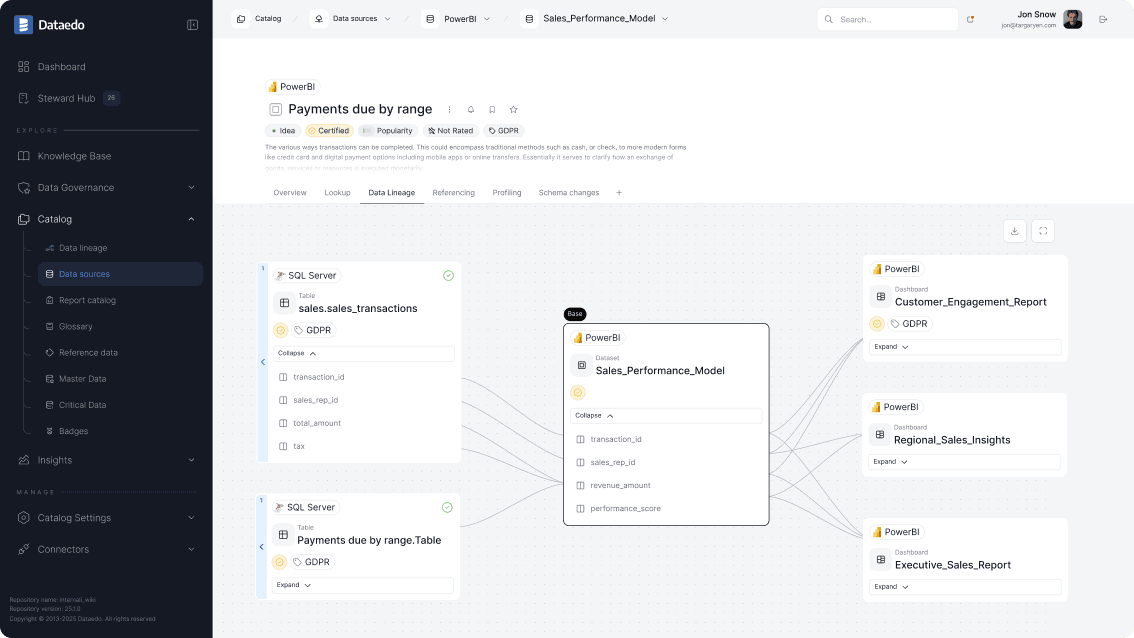
When a key metric looks wrong, you need answers quickly. Dataedo connects your data sources and BI tools, builds visual data lineage, and explains metrics in plain language, so both business and technical teams can see exactly where numbers come from and how they are calculated.
The challenge

Inconsistent KPIs
Different reports show varying values for the same metric, causing confusion and mistrust in analytics.
Unknown data sources
Teams lack visibility into which tables, views, and ETL jobs feed dashboards and reports.
Time-consuming investigations
Investigating issues consumes days of developer time and often involves long email chains.
Risk of downstream errors
Fixing one problem risks breaking another report downstream.
How Dataedo helps
Catalog your sources and BI content
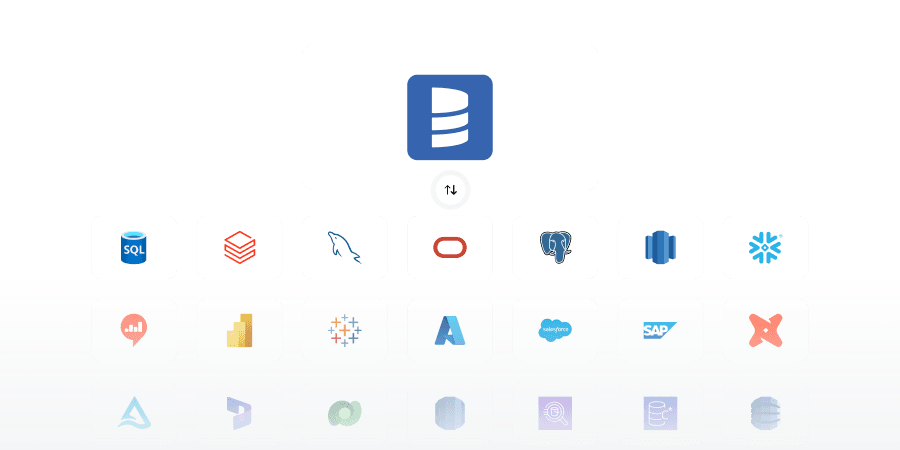
Connect Dataedo to your databases, warehouse, and supported BI tools (Power BI, Tableau) to build a central catalog of tables, views, models, and reports.
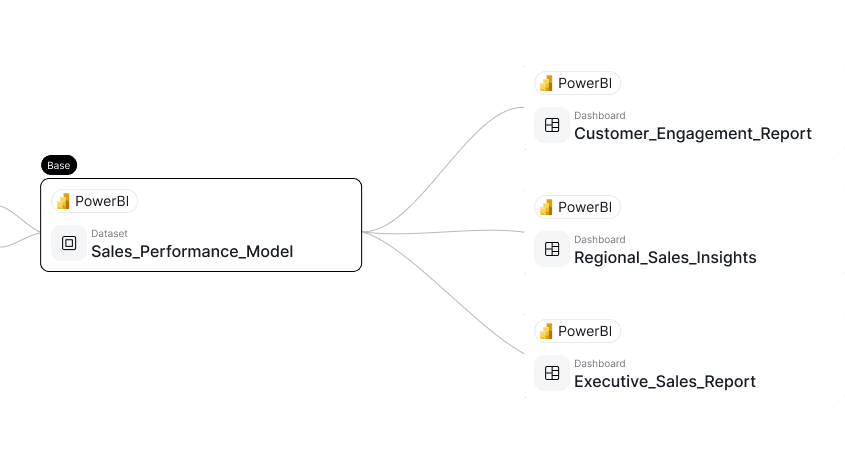
Visualize end-to-end data flows
Use Automatic Data Lineage and column-level lineage to see how data moves from source tables, through ETL logic, into specific dashboards and KPIs.

Explain metrics in business language
Document business definitions, calculation rules, and owners directly on metrics, tables, and columns. Publish them to the Dataedo Portal for everyone to see.

Assess impact before making changes
Use lineage diagrams and impact analysis to identify all reports and objects that depend on a column or table before you modify it.

What you get

Faster incident resolution
Trace incorrect KPIs back to their source in minutes instead of days.
Fewer broken reports
Understand downstream impact before changing structures or ETL logic.
Shared understanding
Business and technical teams finally agree on what each report shows and how it is built.
Key features

Business Glossary
Define metrics, KPIs, and business terms in plain language so all teams understand exactly what each report represents.
Data Catalog
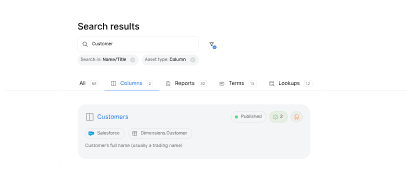
Centralize all tables, views, dashboards, and reports in one searchable catalog for faster discovery and validation.
Data Lineage
Visualize end-to-end data flows from source tables through ETL to dashboards, enabling quick root-cause analysis and impact assessment.
FAQs
What is trusted reporting?
Trusted reporting ensures that business metrics, dashboards, and KPIs are accurate, consistent, and fully traceable back to their source data, giving teams confidence in the numbers they rely on.
How does data lineage help with trusted reporting?
Data lineage maps the flow of data from source tables through transformations to dashboards and KPIs. This visibility allows users to see exactly how each metric is calculated and where discrepancies may occur.
How can a business user verify if a report is "certified" or accurate?
Dataedo allows you to tag and document "Owners" and "Stewards" for every table and KPI. When a user looks at a report in the Dataedo Portal, they can see exactly who is responsible for that data and whether the calculation has been vetted by the data team, building immediate confidence in the numbers.
Can Dataedo help explain complex calculations in "plain language"?
Yes. One of the biggest barriers to trust is technical complexity. Dataedo lets you add a context layer over your technical schema. While the database might call a field rev_adj_fin_v2, Dataedo labels it as "Adjusted Net Revenue" and provides a written description of how it’s calculated, making the data accessible to non-technical stakeholders.
What happens to report trust when the underlying data structure changes?
Trust is broken the moment a report returns an error or a "null" value. Dataedo’s Impact Analysis allows data teams to see which reports will be affected by a change before it’s made. By proactively updating reports or notifying stakeholders, you prevent the "broken dashboard" syndrome that erodes user trust.
Why our customers love Dataedo?
Dataedo is a lightweight solution with great customer service and active product development (recently data quality). The ability to run SQL scripts on the repository brings additional flexibility.

We jump started all of our Data Governance efforts using the tool. We documented key databases quickly and easily and published the information to our analyst community. The Dataedo team is dream to work with and very responsive.

Dataedo is easy to use, offers great functionality, and provides excellent customer service that always listens to the customer.

Dataedo is an amazing tool that continues to grow and improve.

Dataedo excels at data cataloging, and the support from the Dataedo team is top-notch.

Datedo consistently improves while delivering exceptional support that is quick, competent, and highly reliable.

Dataedo provides ease of use and covers so many areas from a Data Governance perspective. You really can put everythng in one place.

Dataedo is a fantastic tool, and I love working with it—especially with the continuous improvements being made and planned.


Piotr Kononow
Founder
See where your reports really come from
Explore Dataedo through a preconfigured data catalog with sample data, try it with your own data during a 14-day free trial, or book a demo.