Entering Data Profiling
To start Data Profiling, you should select the correct option from the top menu. There are now three scopes you can run Data Profiling.
- Run Data Profiling for the whole database (or any selected subset of tables). Available from Dataedo 10.2
- Run Data Profiling only for the selected table.
- Preview Sample Data for the selected table. Available from Dataedo 10.2

You can also start Data Profiling by opening the context menu on Column or Table.
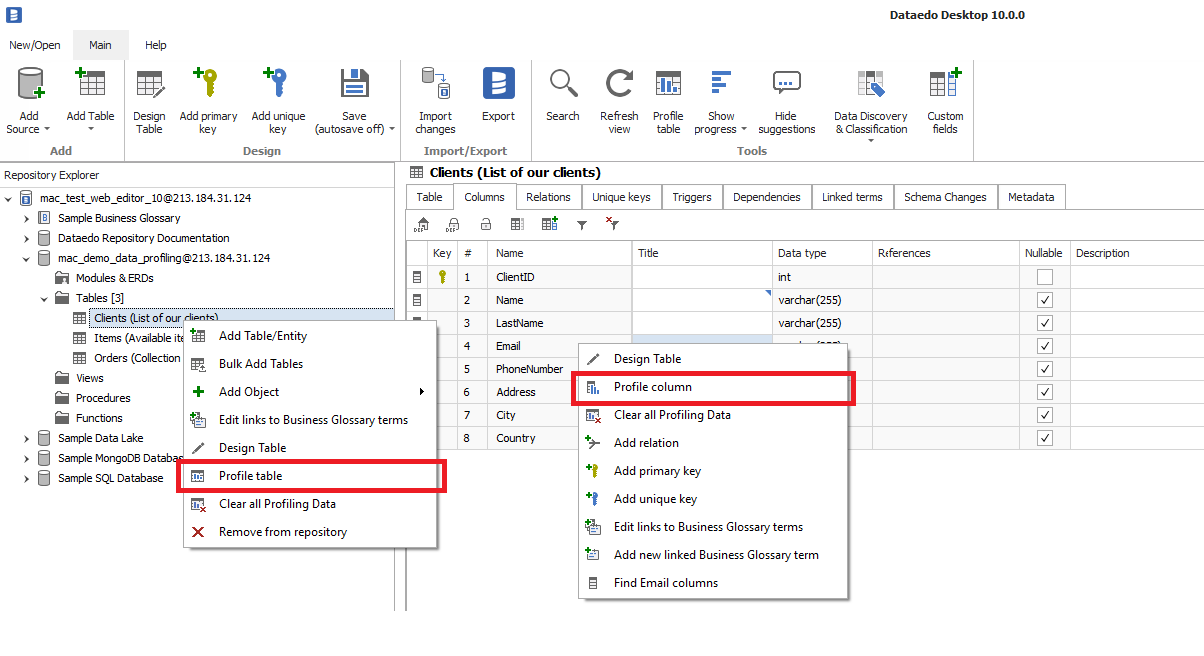
If you don't see the Data Profiling option, probably it is disabled for your repository. Learn more about Data Profiling Configuration
Profiling Window
When you start the Data Profiling, Dataedo will invoke a new window in which you will be able to run profiling and save the results. For easier navigation in the rest of the article let's number and name the sections of the window.
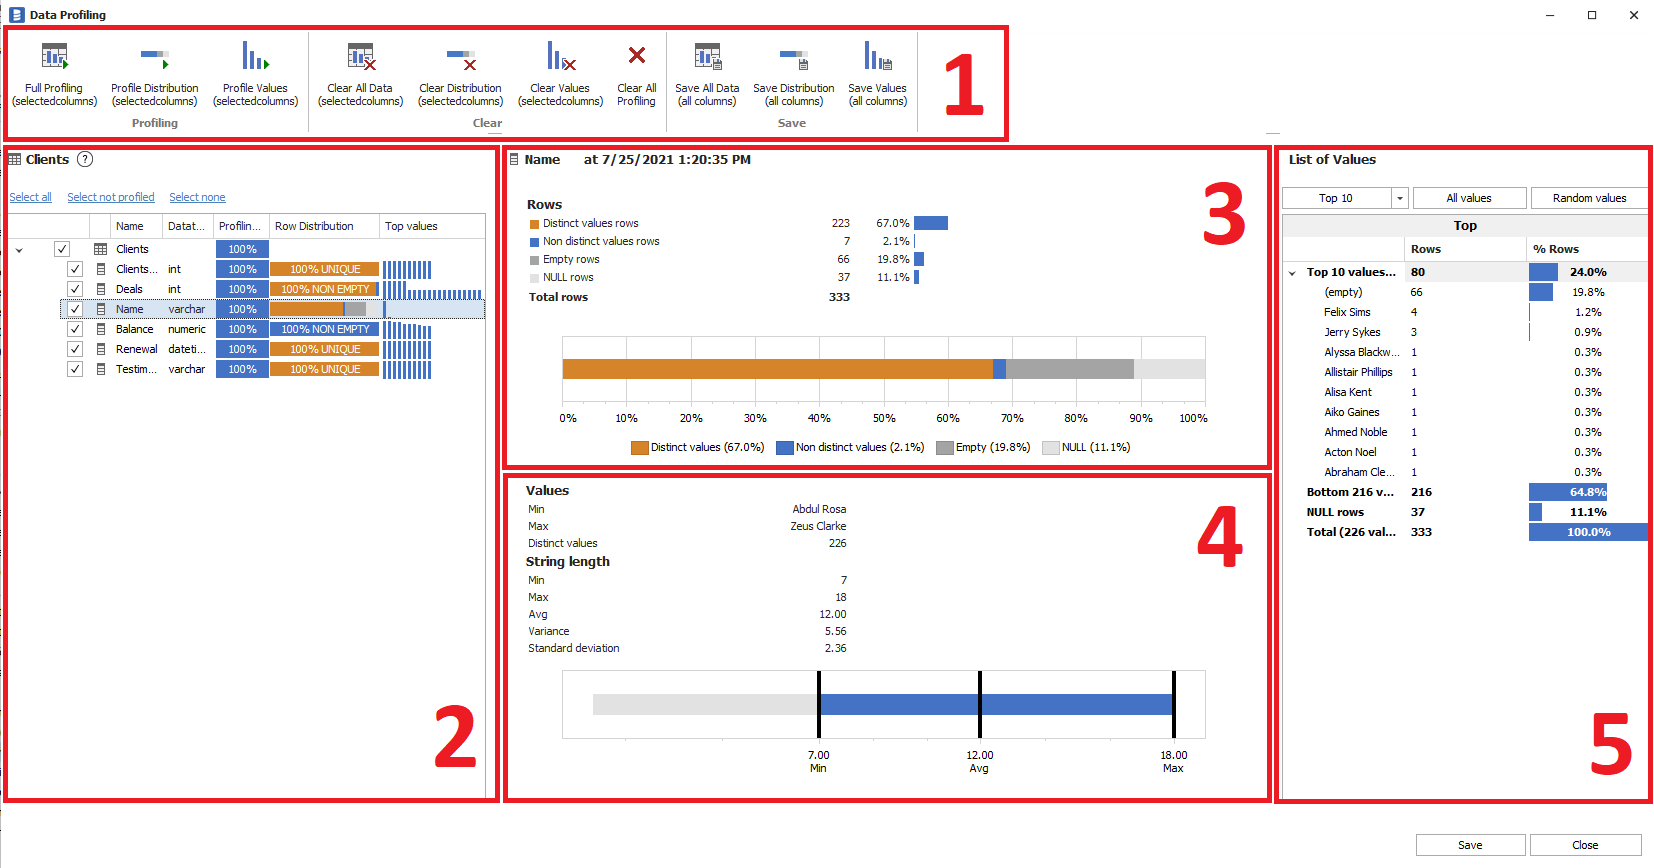
- Profiling ribbon – top section, where you will find the option to run the profiling, save and clear data
- Tree View section - on the left, where you can select an object on which you would like to perform profiling.
- Distribution section – the upper middle one, where you can find summarized information about distribution
- Value Summary section – lower middle one, where you can find summarized information about values
- Values section - on the right, where you can peak into the most common or random values
At the very beginning, your Profiling window will be mostly empty. To display sections other than Profiling ribbon and Tree View, you need to run the profiling.
Scope and Bulk Profiling
With Dataedo 10.2 we introduced the option to start Data Profiling for your whole database (multiple tables). With previous versions, you were able to only scope Data Profiling to tables or columns.
The scope of profiling depends on the entry point.
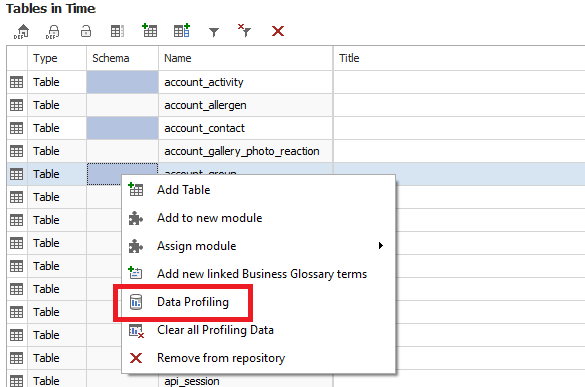
So if you would like to start profiling on multiple tables, simply select them from the tables listing and use the context menu option.
Running Profiling
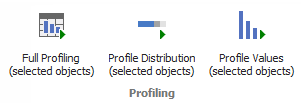
Start with selecting columns in the Tree View. Profiling will be run only on selected objects. Next select one of three options from the Profiling ribbon. You can choose
- Full Profiling (which will run both Distribution and Values)
- Profiling only Distribution
- Profiling only Values
Please bear in mind that Profiling is running on the target database not on a repository database and can cause usage costs.
Sample rows
If you select the table in Tree View, then Profiling will also select 10 example rows from the database. Those rows are preview-only and will never be saved in the repository.

Profiling Distribution
This type of profiling is checking the distribution of values across the whole data set. Such profiling is considered safer to share with someone than Profiling Data, as it provides a general understanding of how values are distributed, but without the danger of leaking the data.
Distribution will be displayed in the middle-top section.

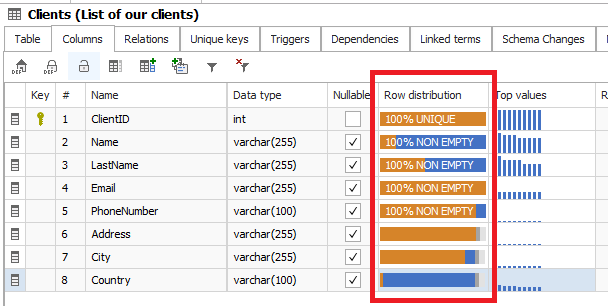
After saving Distribution Data, you will see the visual representation of it in the Row distribution column on Table Columns View.
Profiling Values
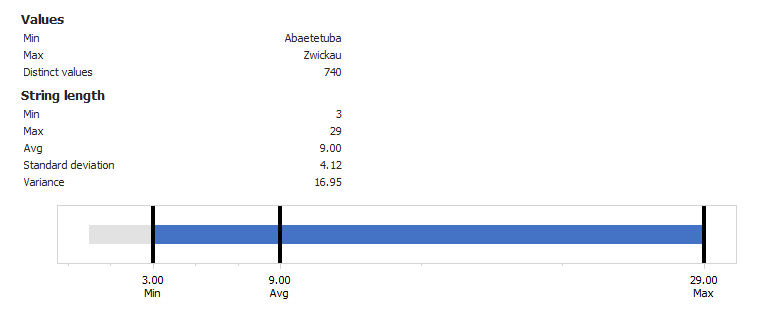
Profiling Values is working on actual data. In the middle section, you will be able to see calculated summaries of data.
Values summary will be displayed in the lower middle section.
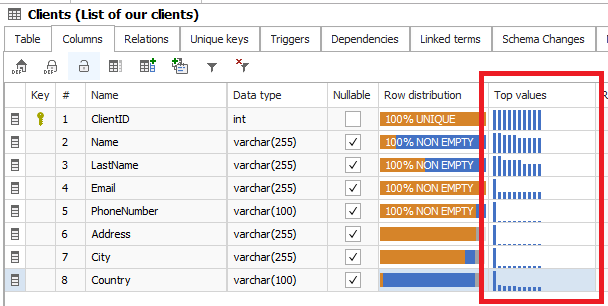
After saving the results, you will see the visual representation of Top Values as a sparkline in the Top values column on Table Columns View.
Profiling the entire table
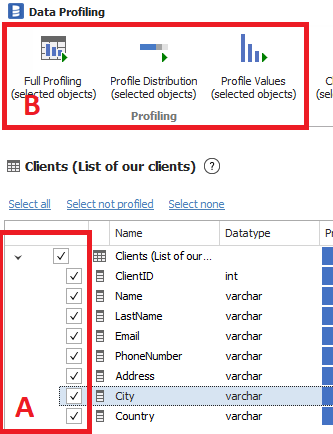
To profile the entire table ensure that you selected all objects in Tree View (A), and then start Profiling (B).
Profiling selected columns
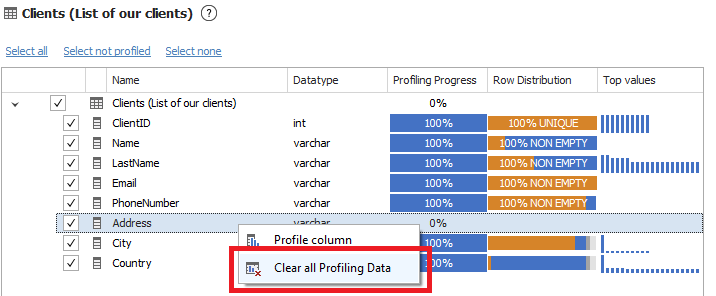
To profile only some columns, select them in Tree View (A), and then start Profiling (B). Alternatively, you can profile columns one by one, using the context menu on them (C).

Saving results to the repository
By default saving results is disabled. You can enable it in your repository configuration. Learn more about Data Profiling Configuration
You can choose if you wish to save all data from Profiling (both Distribution and Values) or only Distribution or Values. You can save data from the Profiling. Data is saved in the repository database for all objects, regardless of the selection in the Tree View.
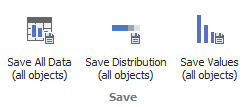
Because results are being saved in the Dataedo repository, the next time you will open the Profiling window, the results will be available without the need to rerun the profiling.
You can rerun the profiling if you think that data are outdated. To help you figure out how old data are, there is a timestamp displayed in the header of the middle section.
Saving only selected columns
To save only data from a subset of the column, you need to clear data from columns that you don't want to save. If I don't want to save data from the LastName column - I will select it (A), Clear it (B), and then save everything else (C).
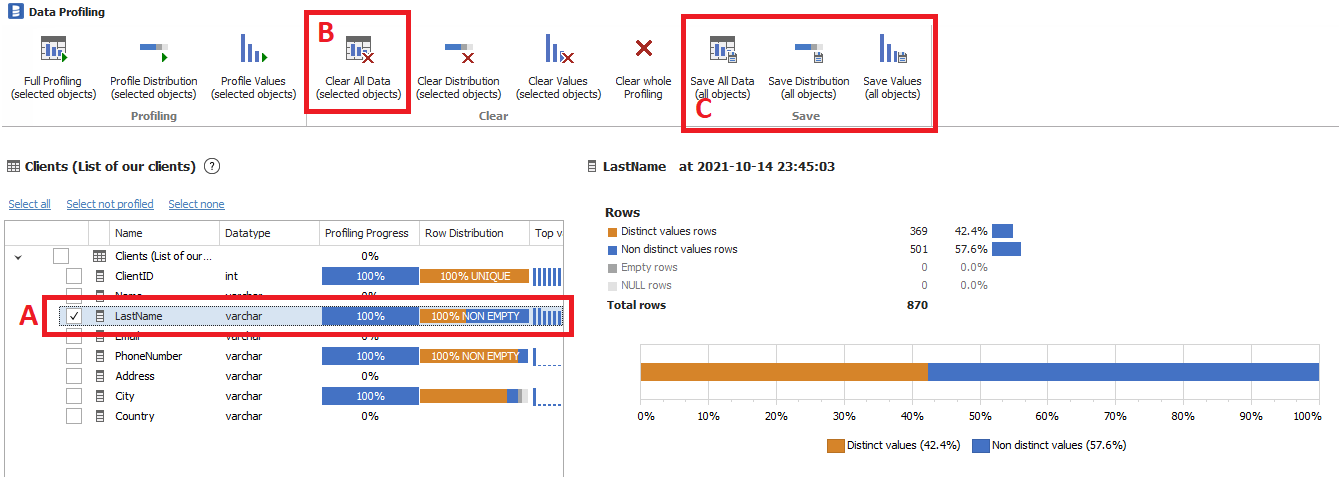
The logic is that we are saving all columns which are profiled. You can however pick what data is being saved for them.
Saving only selected data (distribution or values)
If you would like to save only distribution data and omit values, then simply click on the correct Save button (A).
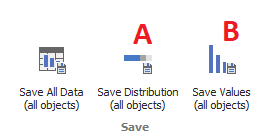
Also in the scenario when you would like to save Top Values and hide the distribution. You can use the correct button (B).
Viewing saved results
To view Profiling Results just select the table or column you are interested in and open the Profiling window. Basic information, such as Row distribution or Top values sparkline, is displayed in the main Dataedo window.

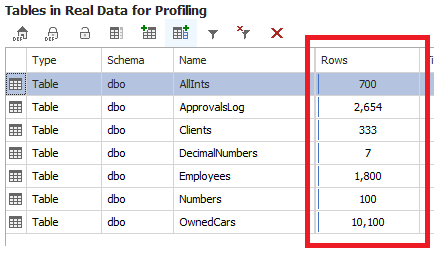
Also, the number of rows is available from the Tables view.
Deleting results from repository
There are a few ways how you can delete profiling data from the repository.
Deleting all table profiling
If you would like to delete all Profiling data for a table, just right-click it and select "Clear all Profiling Data".
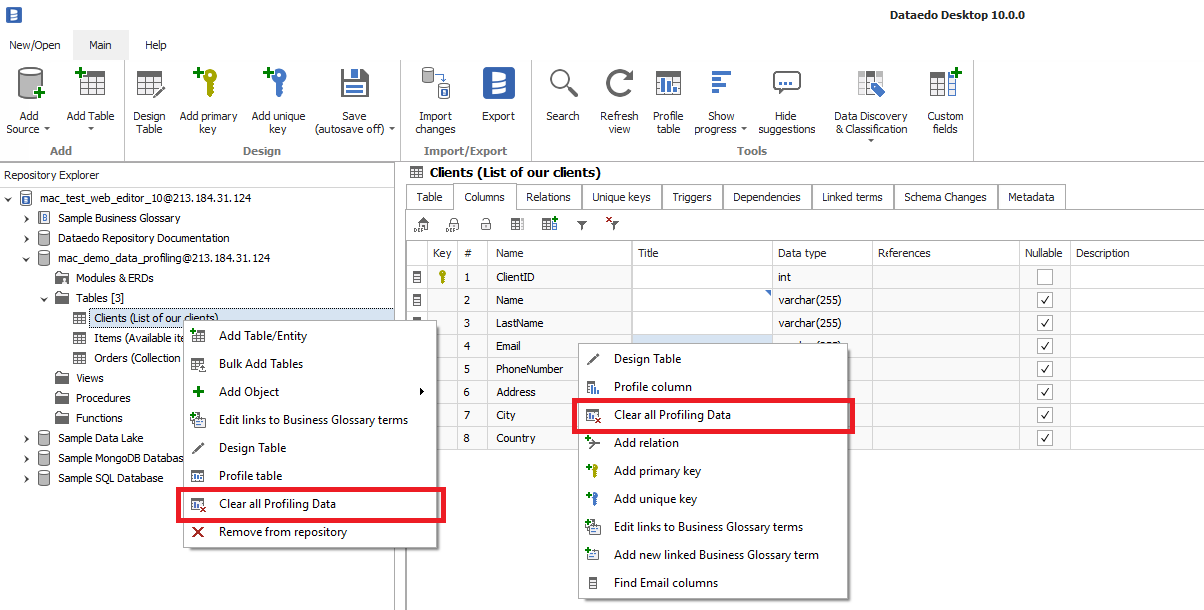
The same context menu option is also present for columns and clears only Profiling data for a column.
Clearing values (sensitive data)
In case you would like to clear only values, open Profiling for a table, select objects you would like to clear (A), and then click on "Clear Values" (B).
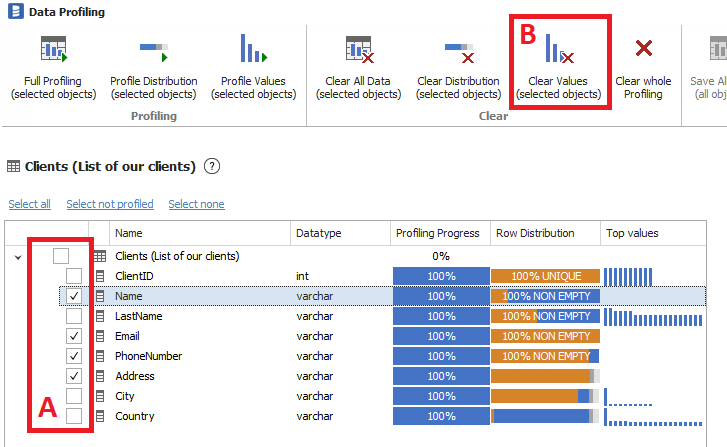
Values are being instantly deleted from the repository, so there is no need to save any changes. Similarly, you can clear only distribution and leave top values.
Clearing selected columns
You can use the above example to clear data from selected columns. You can also select them one by one from the context menu.


 Mac Lewandowski